QUESTION IMAGE
Question
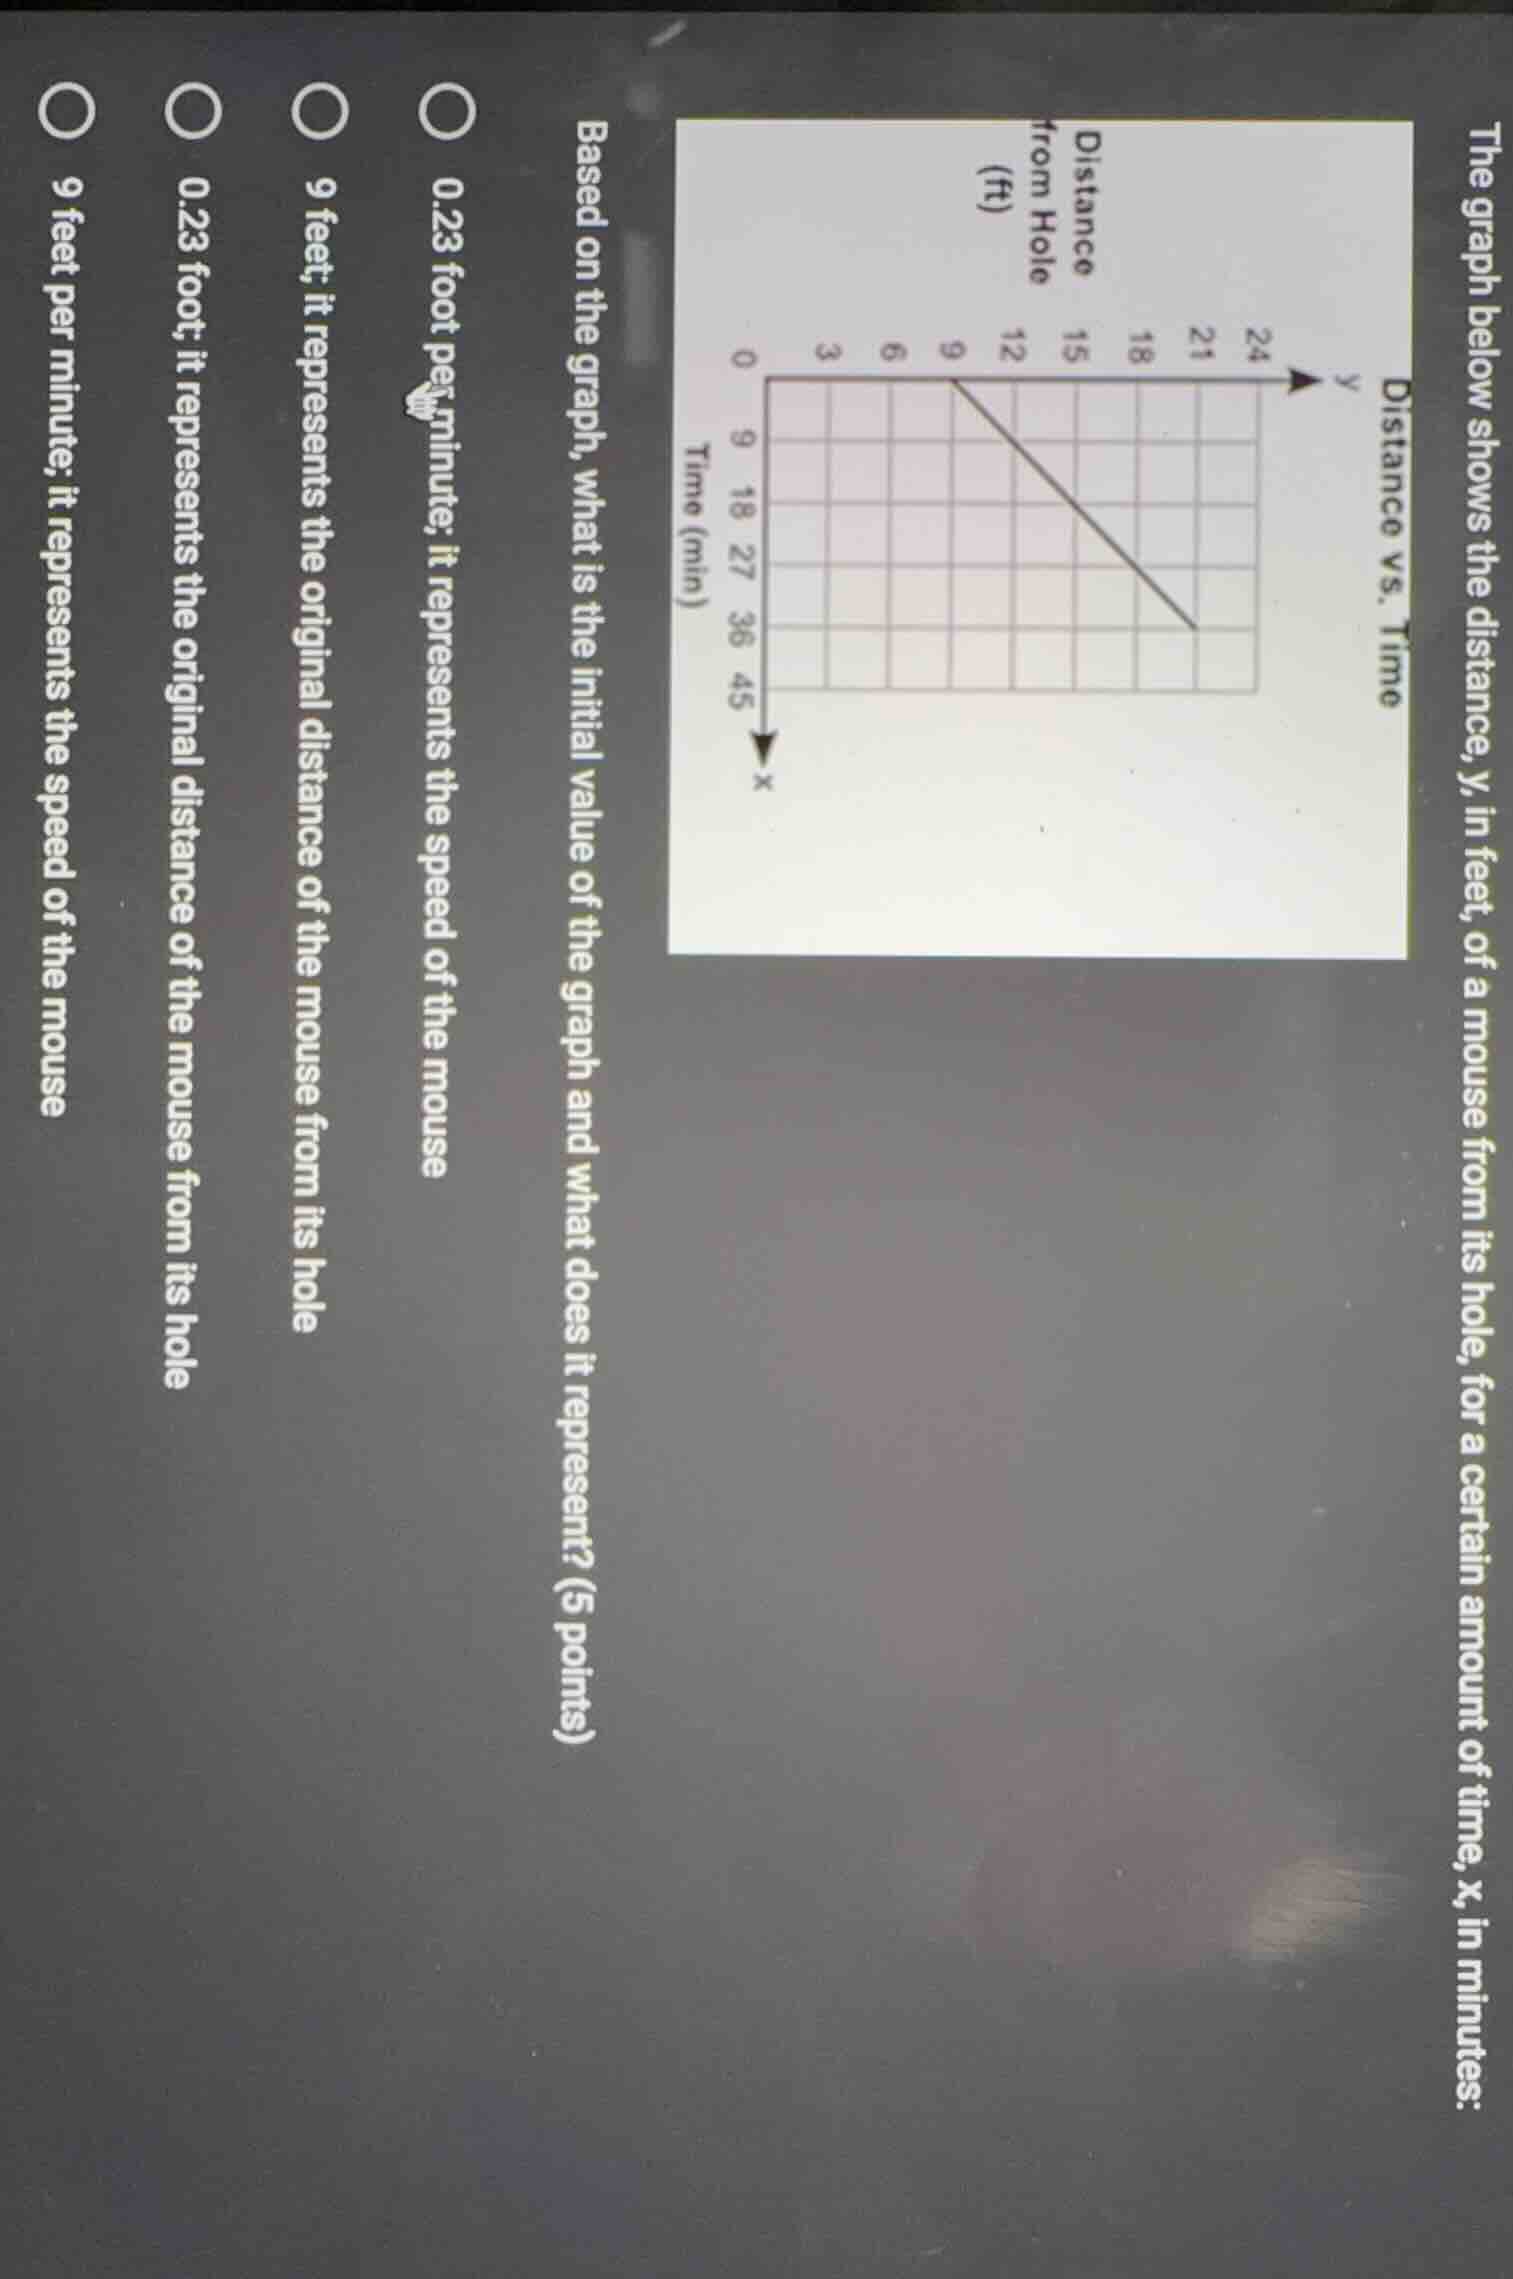
the graph below shows the distance, y, in feet, of a mouse from its hole, for a certain amount of time, x, in minutes: distance vs. time based on the graph, what is the initial value of the graph and what does it represent? (5 points) 0.23 foot per minute; it represents the speed of the mouse 9 feet; it represents the original distance of the mouse from its hole 0.23 foot; it represents the original distance of the mouse from its hole 9 feet per minute; it represents the speed of the mouse
Step1: Identify initial value
The initial value is the y-value when $x=0$. From the graph, at $x=0$, $y=9$. This is the starting distance from the hole.
Step2: Analyze the value's meaning
The initial value (y at x=0) represents the original distance of the mouse from its hole at time 0.
Step3: Eliminate incorrect options
The speed would be the slope $\frac{\Delta y}{\Delta x}=\frac{24-9}{36-0}=\frac{15}{36}\approx0.42$ ft/min, so speed-related options are wrong. The initial value is 9 feet, not 0.23.

Snap & solve any problem in the app
Get step-by-step solutions on Sovi AI
Photo-based solutions with guided steps
Explore more problems and detailed explanations
9 feet; it represents the original distance of the mouse from its hole