QUESTION IMAGE
Question
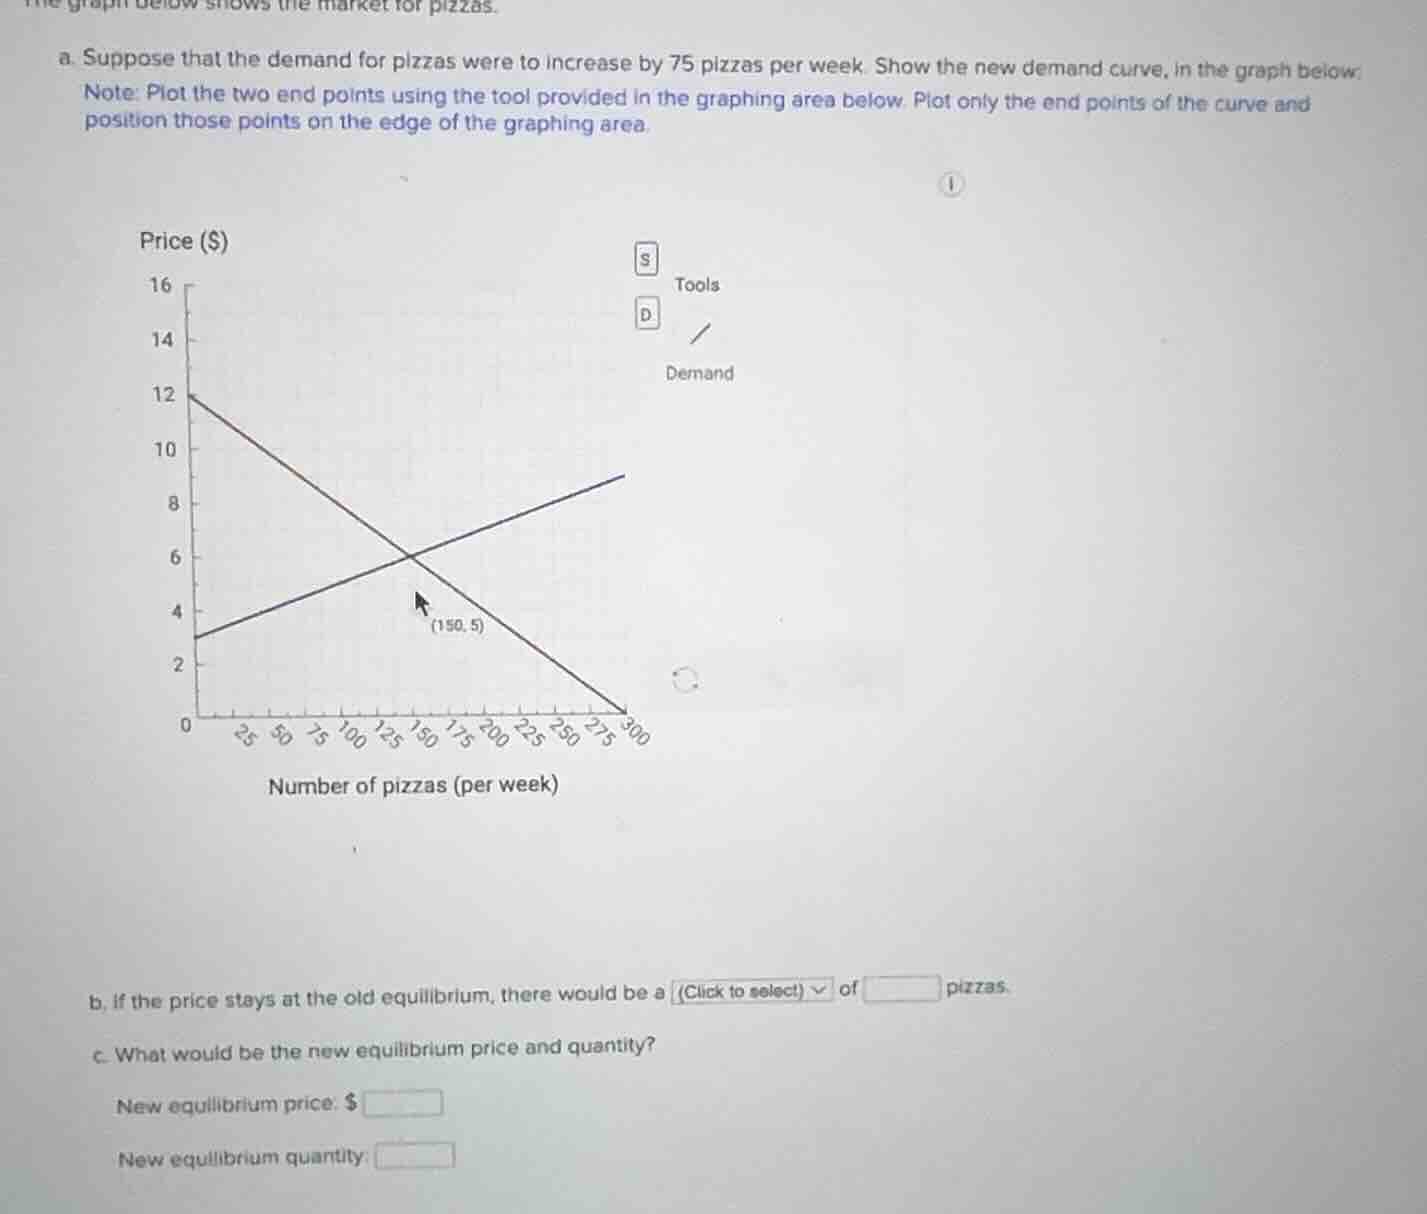
the graph below shows the market for pizzas.
a. suppose that the demand for pizzas were to increase by 75 pizzas per week. show the new demand curve, in the graph below.
note: plot the two end points using the tool provided in the graphing area below. plot only the end points of the curve and position those points on the edge of the graphing area.
(graph with price ($) on y - axis from 0 to 16, number of pizzas (per week) on x - axis from 0 to 300, with supply (s) and demand (d) curves, and equilibrium point (150, 5))
b. if the price stays at the old equilibrium, there would be a (click to select) of ______ pizzas.
c. what would be the new equilibrium price and quantity?
new equilibrium price: $
new equilibrium quantity:
Step1: Find original demand endpoints
Original demand has endpoints: (0, 12) and (300, 0).
Step2: Shift demand right by 75
At price $12$, new quantity = $0 + 75 = 75$. At price $0$, new quantity = $300 + 75 = 375$. New demand endpoints: (75, 12) and (375, 0).
Step3: Identify old equilibrium
Old equilibrium is (150, 5). At price $5$, original quantity demanded = 150, new quantity demanded = $150 + 75 = 225$. Quantity supplied at $5$ is 150. Shortage = $225 - 150 = 75$.
Step4: Derive demand/supply equations
Original demand: $P = 12 - \frac{12}{300}Q = 12 - 0.04Q$. New demand: $P = 12 - 0.04(Q-75) = 12 - 0.04Q + 3 = 15 - 0.04Q$.
Supply: $P = 3 + \frac{6}{300}Q = 3 + 0.02Q$.
Step5: Solve for new equilibrium
Set new demand = supply:
$$15 - 0.04Q = 3 + 0.02Q$$
$$15 - 3 = 0.04Q + 0.02Q$$
$$12 = 0.06Q$$
$$Q = \frac{12}{0.06} = 200$$
Substitute $Q=200$ into supply: $P = 3 + 0.02(200) = 3 + 4 = 7$.

Snap & solve any problem in the app
Get step-by-step solutions on Sovi AI
Photo-based solutions with guided steps
Explore more problems and detailed explanations
a. New demand curve endpoints: (75, 12) and (375, 0) (plot these on the graph)
b. shortage; 75
c. New equilibrium price: $\$7$
New equilibrium quantity: 200 pizzas per week