QUESTION IMAGE
Question
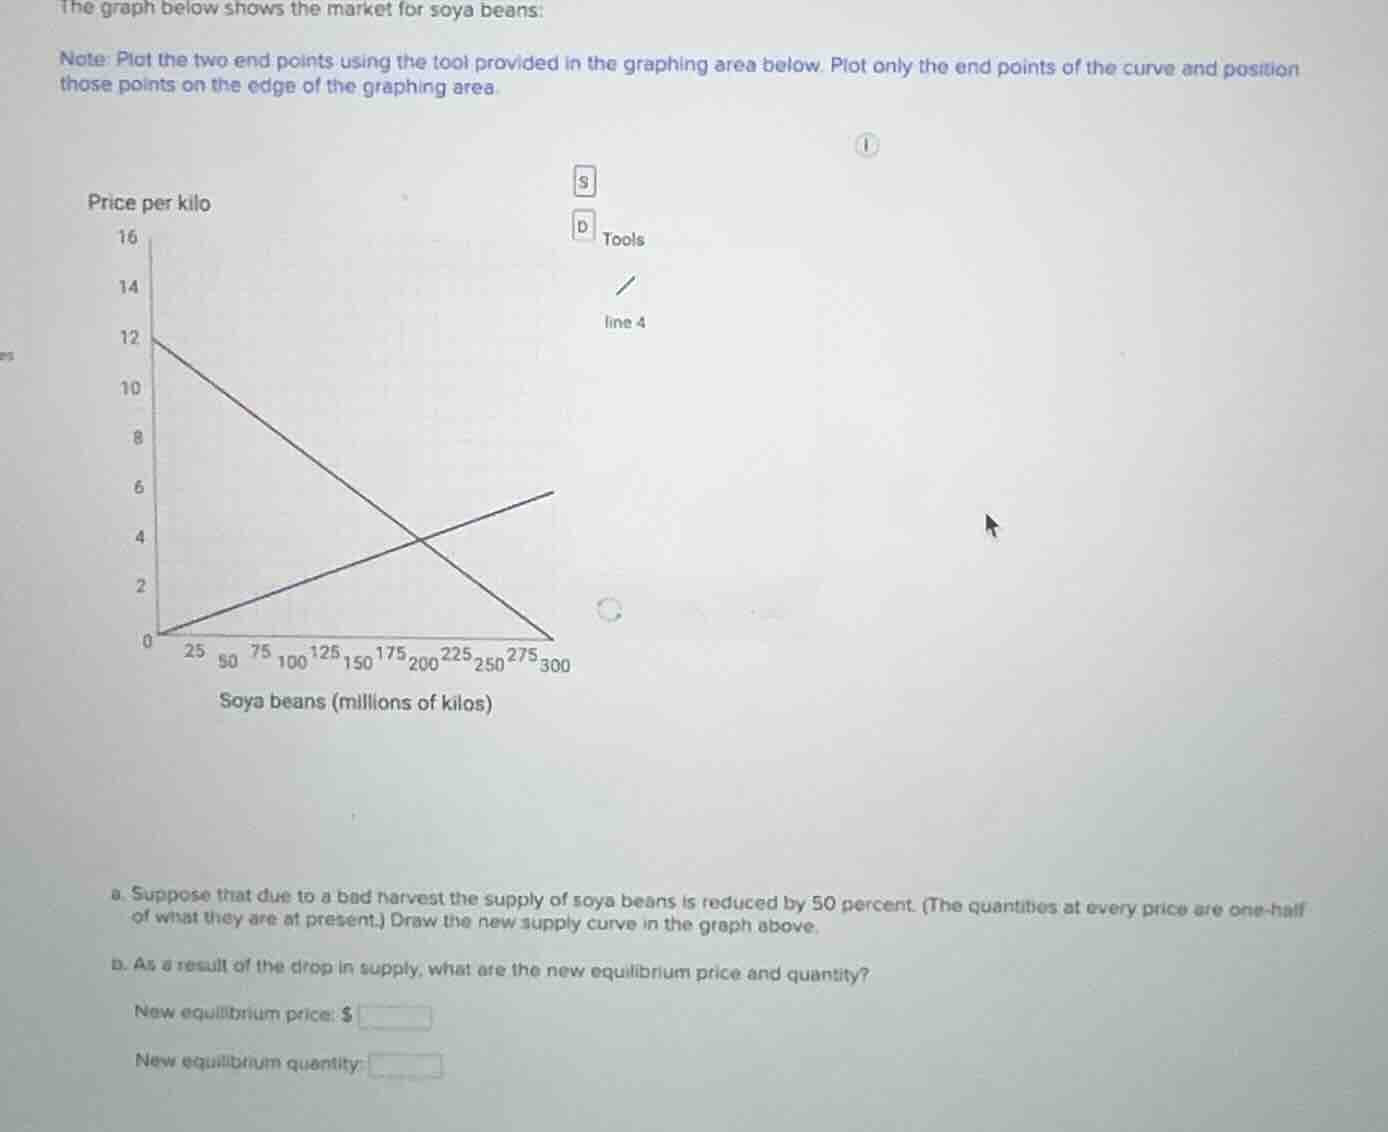
the graph below shows the market for soya beans:
note: plot the two end points using the tool provided in the graphing area below. plot only the end points of the curve and position those points on the edge of the graphing area.
a. suppose that due to a bad harvest the supply of soya beans is reduced by 50 percent. (the quantities at every price are one - half of what they are at present.) draw the new supply curve in the graph above.
b. as a result of the drop in supply, what are the new equilibrium price and quantity?
new equilibrium price: $
new equilibrium quantity:
Step1: Identify original supply points
Original supply line goes from $(0, 0)$ to $(300, 6)$.
Step2: Calculate new supply quantities
At each price, quantity is $\frac{1}{2}$ of original. New points: $(0, 0)$ and $(150, 6)$.
Step3: Find original demand equation
Demand line connects $(0, 12)$ and $(300, 0)$. Slope $m=\frac{0-12}{300-0}=-0.04$. Equation: $P = 12 - 0.04Q$.
Step4: Find new supply equation
New supply line connects $(0, 0)$ and $(150, 6)$. Slope $m=\frac{6-0}{150-0}=0.04$. Equation: $P = 0.04Q$.
Step5: Solve for equilibrium
Set demand = supply:
$$12 - 0.04Q = 0.04Q$$
$$12 = 0.08Q$$
$$Q = \frac{12}{0.08} = 150$$
Substitute $Q=150$ into supply equation: $P = 0.04\times150 = 6$.

Snap & solve any problem in the app
Get step-by-step solutions on Sovi AI
Photo-based solutions with guided steps
Explore more problems and detailed explanations
New equilibrium price: $\$6$
New equilibrium quantity: 150 million kilos
(For part a, the new supply curve is drawn by plotting the points $(0, 0)$ and $(150, 6)$ and connecting them.)