QUESTION IMAGE
Question
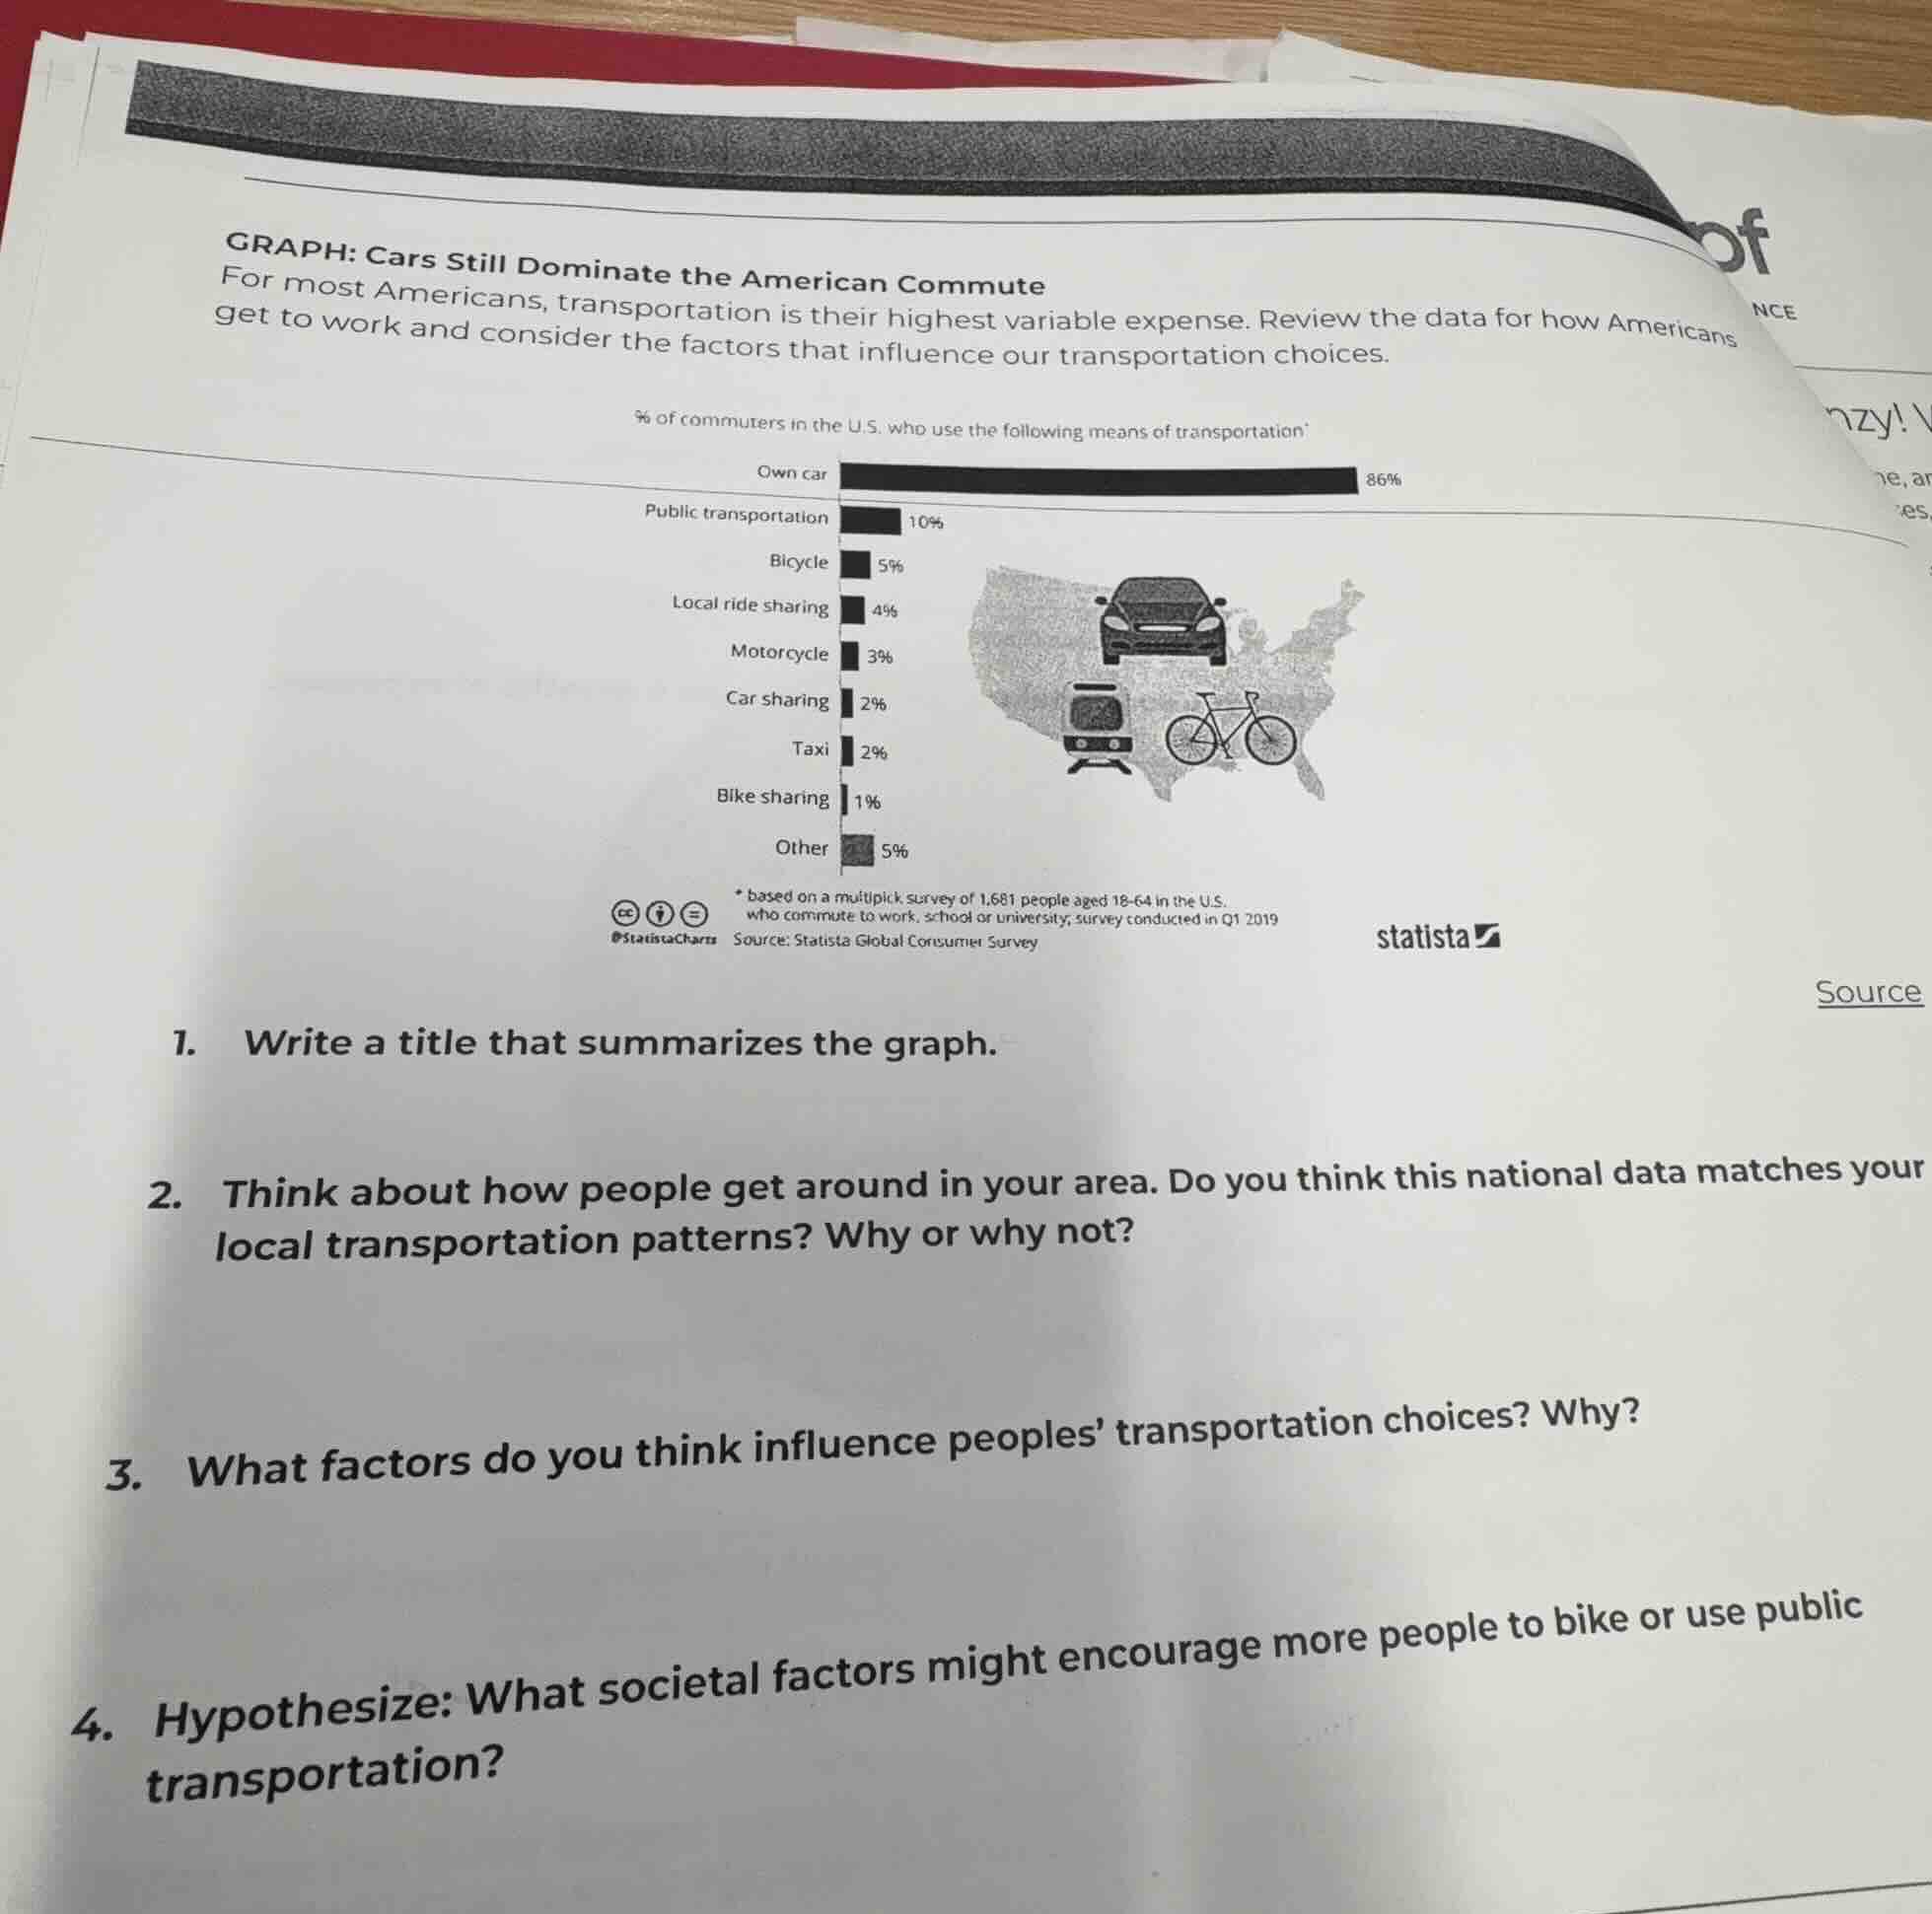
graph: cars still dominate the american commute
for most americans, transportation is their highest variable expense. review the data for how americans get to work and consider the factors that influence our transportation choices.
% of commuters in the u.s. who use the following means of transportation
own car 86%
public transportation 10%
bicycle 5%
local ride sharing 4%
motorcycle 3%
car sharing 2%
taxi 2%
bike sharing 1%
other 5%
- based on a multipick survey of 1,681 people aged 18 - 64 in the u.s. who commute to work, school or university; survey conducted in q1 2019
source: statista global consumer survey
- write a title that summarizes the graph.
- think about how people get around in your area. do you think this national data matches your local transportation patterns? why or why not?
- what factors do you think influence peoples’ transportation choices? why?
- hypothesize: what societal factors might encourage more people to bike or use public transportation?
Brief Explanations
- The title distills the core data: U.S. commuter transport modes with private cars as the clear majority.
- Uses a dense urban area example to contrast national data, citing infrastructure and density differences.
- Lists practical, cost, and accessibility factors that directly shape how people choose to commute.
- Identifies systemic, policy, and infrastructure changes that would lower barriers to biking and public transit.

Snap & solve any problem in the app
Get step-by-step solutions on Sovi AI
Photo-based solutions with guided steps
Explore more problems and detailed explanations
- "U.S. Commuter Transportation Modes: 86% Rely on Personal Cars"
- No, this national data does not match local patterns in a dense urban area like New York City. In this local area, public transportation use is far higher (over 50% of commuters) and personal car use is much lower, because dense urban cores have extensive, reliable public transit, limited parking, and high costs of car ownership.
- Key factors include:
- Cost: Car ownership (insurance, gas, maintenance) is far more expensive than biking or public transit for many.
- Accessibility: Proximity to public transit stops, safe bike lanes, or distance to work.
- Convenience: Door-to-door flexibility of personal cars, especially in suburban/rural areas with poor transit.
- Societal factors that would encourage more biking and public transit use include:
- Expanding and funding reliable, frequent public transit networks to cover more areas.
- Building protected bike lanes and bike storage infrastructure to improve safety.
- Implementing policies like congestion pricing for cars in urban areas, or subsidies for public transit passes.
- Investing in public transit frequency and reliability to reduce commute times.
- Promoting public awareness campaigns about the environmental and health benefits of biking/transit.