QUESTION IMAGE
Question
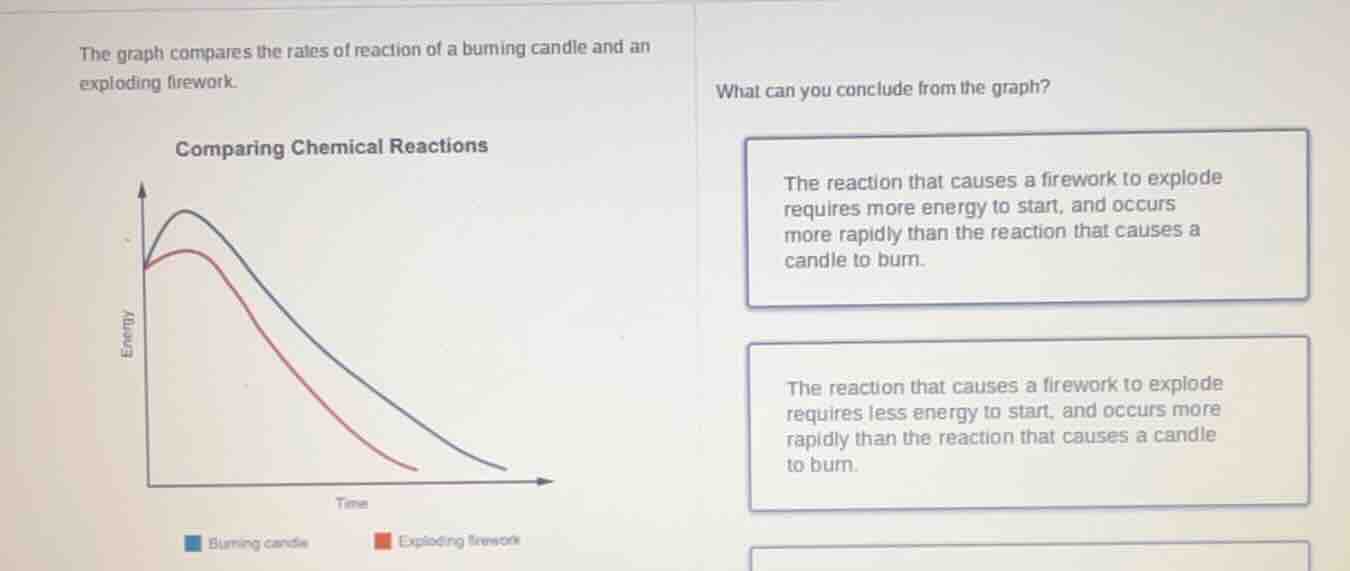
the graph compares the rates of reaction of a burning candle and an exploding firework.
comparing chemical reactions
what can you conclude from the graph?
the reaction that causes a firework to explode requires more energy to start, and occurs more rapidly than the reaction that causes a candle to burn.
the reaction that causes a firework to explode requires less energy to start, and occurs more rapidly than the reaction that causes a candle to burn.
- Activation Energy (Start Energy): The peak of each curve represents the activation energy needed to start the reaction. The blue curve (burning candle) has a higher peak than the red curve (exploding firework), meaning the candle reaction requires more initial energy to start.
- Reaction Rate: The steepness of the downward slope shows how quickly the reaction proceeds (energy is released). The red curve (firework) falls much more steeply than the blue curve (candle), indicating the firework reaction occurs far more rapidly.
- Match to Options: The correct conclusion is that the firework reaction requires less energy to start and occurs more rapidly than the candle burning reaction.

Snap & solve any problem in the app
Get step-by-step solutions on Sovi AI
Photo-based solutions with guided steps
Explore more problems and detailed explanations
The reaction that causes a firework to explode requires less energy to start, and occurs more rapidly than the reaction that causes a candle to burn.