QUESTION IMAGE
Question
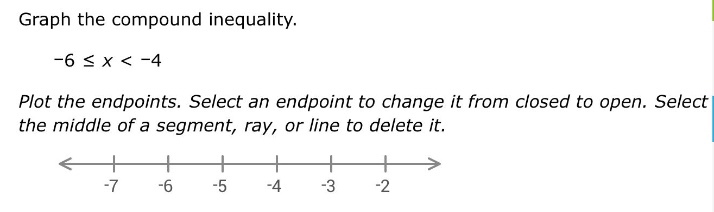
graph the compound inequality.
-6 ≤ x < -4
plot the endpoints. select an endpoint to change it from closed to open. select the middle of a segment, ray, or line to delete it.
number line with -7, -6, -5, -4, -3, -2 marked
Step1: Analyze the inequality
The compound inequality is \(-6 \leq x < -4\). This means \(x\) is greater than or equal to \(-6\) and less than \(-4\).
Step2: Plot the endpoints
- For \(-6\): Since the inequality is \(\leq\), we use a closed dot (filled circle) at \(-6\) because \(x\) can be equal to \(-6\).
- For \(-4\): Since the inequality is \(<\), we use an open dot (unfilled circle) at \(-4\) because \(x\) cannot be equal to \(-4\).
Step3: Draw the segment
Draw a line segment connecting the closed dot at \(-6\) and the open dot at \(-4\). This segment represents all the values of \(x\) that satisfy the compound inequality \(-6 \leq x < -4\).

Snap & solve any problem in the app
Get step-by-step solutions on Sovi AI
Photo-based solutions with guided steps
Explore more problems and detailed explanations
To graph \(-6 \leq x < -4\):
- Place a closed dot (filled circle) at \(x = -6\) (because \(x\) can equal \(-6\)).
- Place an open dot (unfilled circle) at \(x = -4\) (because \(x\) cannot equal \(-4\)).
- Draw a line segment connecting the closed dot at \(-6\) to the open dot at \(-4\).