QUESTION IMAGE
Question
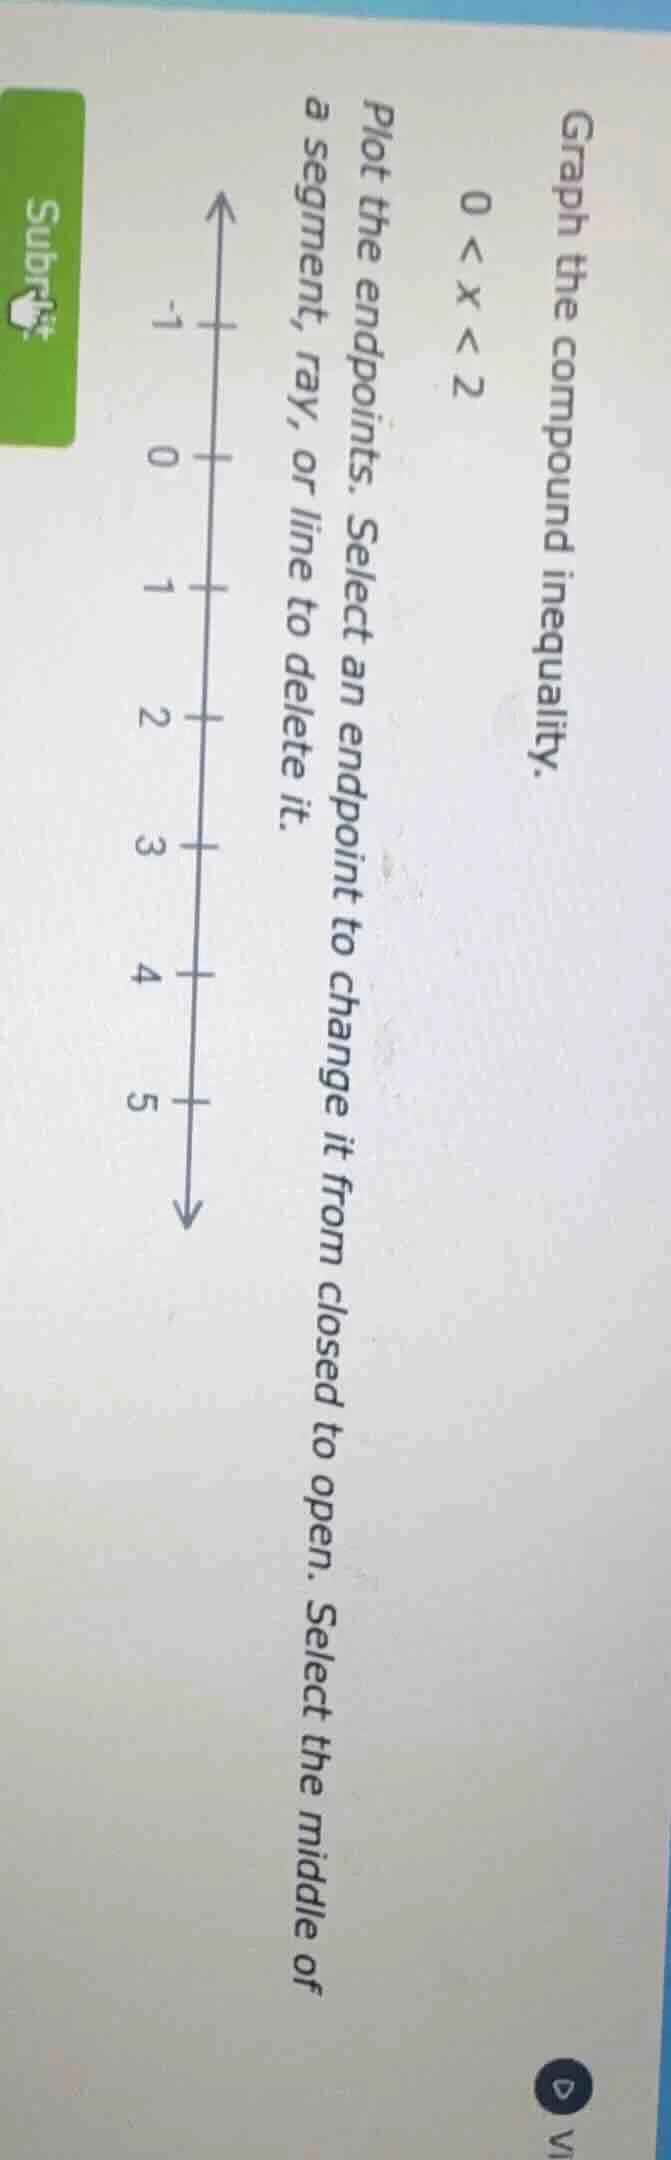
graph the compound inequality.
$0 < x < 2$
plot the endpoints. select an endpoint to change it from closed to open. select the middle of a segment, ray, or line to delete it.
Step1: Identify inequality endpoints
The inequality is $0 < x < 2$, so endpoints are $x=0$ and $x=2$.
Step2: Mark endpoints as open circles
Since the inequality uses $<$ (not $\leq$), both endpoints are excluded, so we use open circles at $0$ and $2$ on the number line.
Step3: Shade between endpoints
Shade the segment of the number line that lies between the open circles at $0$ and $2$, as this represents all values of $x$ that satisfy $0 < x < 2$.

Snap & solve any problem in the app
Get step-by-step solutions on Sovi AI
Photo-based solutions with guided steps
Explore more problems and detailed explanations
- Draw an open circle at $x=0$ and an open circle at $x=2$ on the provided number line.
- Shade the line segment connecting these two open circles.