QUESTION IMAGE
Question
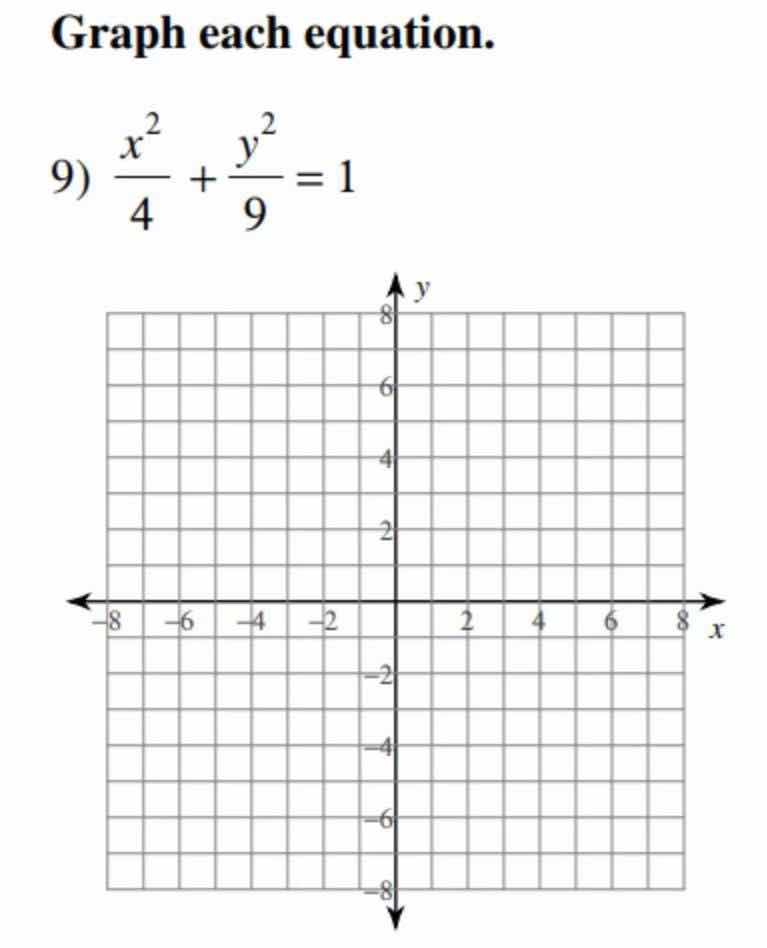
graph each equation.
- \\(dfrac{x^2}{4} + dfrac{y^2}{9} = 1\\)
Step1: Identify the conic section
The equation is \(\frac{x^2}{4}+\frac{y^2}{9} = 1\), which is in the standard form of an ellipse \(\frac{x^2}{b^2}+\frac{y^2}{a^2}=1\) (since \(a^2 = 9\) and \(b^2=4\), so \(a = 3\), \(b = 2\)) with a vertical major axis (because \(a>b\) and the \(y^2\) term has the larger denominator).
Step2: Find the vertices and co - vertices
- For the \(y\) - axis (major axis) vertices: When \(x = 0\), we solve for \(y\). Substitute \(x = 0\) into the equation \(\frac{0^2}{4}+\frac{y^2}{9}=1\), which gives \(y^2=9\), so \(y=\pm3\). So the vertices are \((0, 3)\) and \((0,- 3)\).
- For the \(x\) - axis (minor axis) co - vertices: When \(y = 0\), we solve for \(x\). Substitute \(y = 0\) into the equation \(\frac{x^2}{4}+\frac{0^2}{9}=1\), which gives \(x^2 = 4\), so \(x=\pm2\). So the co - vertices are \((2,0)\) and \((- 2,0)\).
Step3: Plot the points and draw the ellipse
Plot the points \((0,3)\), \((0, - 3)\), \((2,0)\) and \((-2,0)\) on the coordinate plane. Then, sketch the ellipse by connecting these points smoothly, making sure that the ellipse is symmetric about both the \(x\) - axis and \(y\) - axis.
To graph the ellipse:
- Mark the center at the origin \((0,0)\) (since there are no shifts in the \(x\) or \(y\) terms in the equation \(\frac{x^2}{4}+\frac{y^2}{9}=1\)).
- Plot the vertices \((0,3)\) (3 units up from the center on the \(y\) - axis) and \((0, - 3)\) (3 units down from the center on the \(y\) - axis).
- Plot the co - vertices \((2,0)\) (2 units to the right of the center on the \(x\) - axis) and \((-2,0)\) (2 units to the left of the center on the \(x\) - axis).
- Draw a smooth curve connecting these four points, forming an ellipse that is wider along the \(y\) - axis.

Snap & solve any problem in the app
Get step-by-step solutions on Sovi AI
Photo-based solutions with guided steps
Explore more problems and detailed explanations
The graph is an ellipse centered at the origin with vertices at \((0, \pm 3)\) and co - vertices at \((\pm 2,0)\), plotted as described above.