QUESTION IMAGE
Question
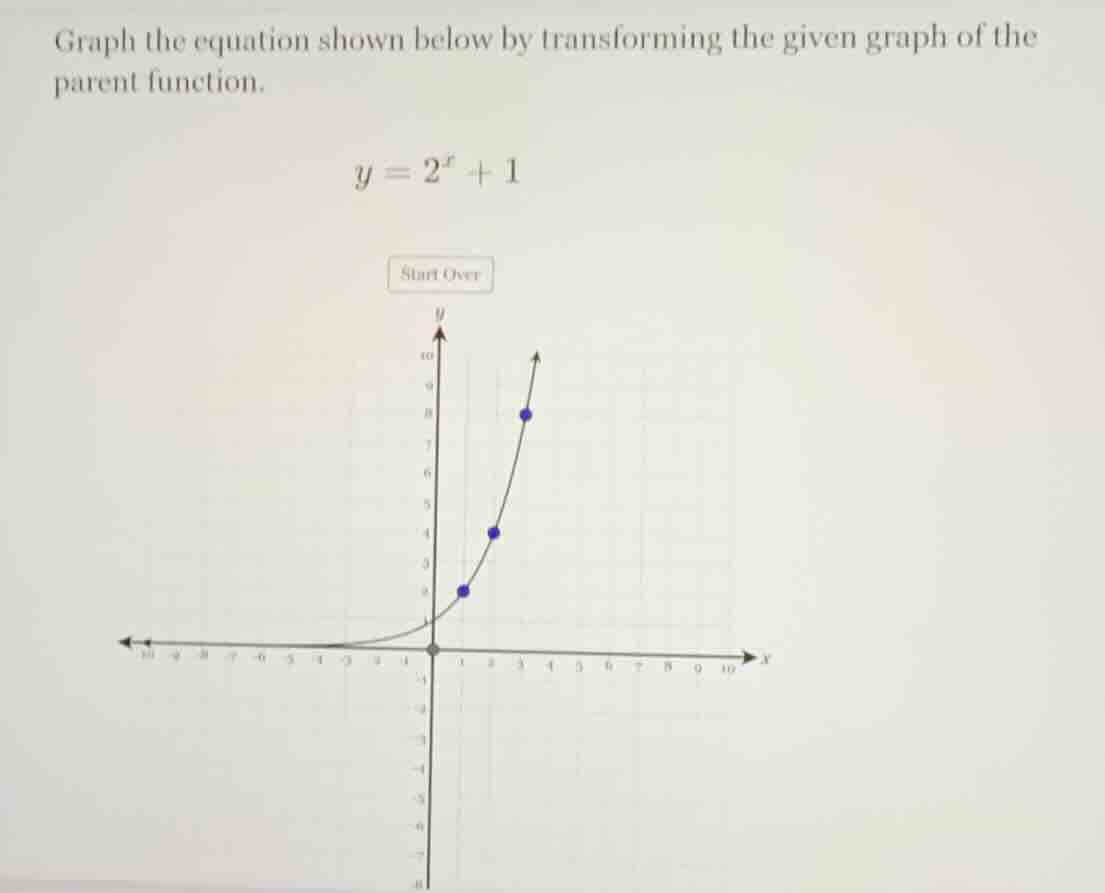
graph the equation shown below by transforming the given graph of the parent function.
$y = 2^x + 1$
Step1: Identify the parent function
The parent function here is \( y = 2^x \). The given graph in the image appears to be the graph of \( y = 2^x \) (passing through \((0,1)\), \((1,2)\), \((2,4)\), \((3,8)\) etc., but in the image, the points shown are likely \((0,1)\) (but marked at \((0,0)\) maybe a typo), \((1,2)\) (but in the image, the points are at \((1,2)\) - wait, the image has points at \(x = 0\) (y=2?), \(x = 1\) (y=4?), \(x = 2\) (y=8?) Wait, no, the parent function \(y = 2^x\) has: when \(x = 0\), \(y = 1\); \(x = 1\), \(y = 2\); \(x = 2\), \(y = 4\); \(x = 3\), \(y = 8\). But the given graph in the image has a point at \((0,0)\) (maybe the parent function here is \(y = 2^x - 1\)? No, the equation to graph is \(y = 2^x + 1\).
Step2: Recall vertical shift transformation
For a function \(y = f(x) + k\), if \(k>0\), it is a vertical shift up by \(k\) units. Here, \(f(x)=2^x\) and \(k = 1\), so we shift the graph of \(y = 2^x\) up by 1 unit.
Step3: Transform key points of the parent function
- For the parent function \(y = 2^x\), when \(x = 0\), \(y = 1\). After shifting up by 1, the point becomes \((0, 1 + 1)=(0, 2)\).
- When \(x = 1\), \(y = 2\) for parent, after shift: \((1, 2 + 1)=(1, 3)\)? Wait, no, in the image, the points are at \(x = 0\) (y=2), \(x = 1\) (y=4), \(x = 2\) (y=8)? Wait, maybe the parent function in the image is \(y = 2^x\) (but with a point at (0,1) shifted? Wait, no, the equation to graph is \(y = 2^x + 1\). Let's list the transformed points:
Parent function \(y = 2^x\) points:
- \(x = -2\): \(y = 2^{-2}=\frac{1}{4}\), shifted up: \(y=\frac{1}{4}+1=\frac{5}{4}=1.25\) (but not shown)
- \(x = -1\): \(y = 2^{-1}=\frac{1}{2}\), shifted up: \(y=\frac{1}{2}+1=\frac{3}{2}=1.5\) (not shown)
- \(x = 0\): \(y = 1\), shifted up: \(y = 2\) (point (0,2))
- \(x = 1\): \(y = 2\), shifted up: \(y = 3\)? Wait, no, in the image, the points are at \(x = 0\) (y=2), \(x = 1\) (y=4), \(x = 2\) (y=8). Wait, maybe the parent function in the image is \(y = 2^x\) (since \(2^0=1\), but in the image, the origin is at (0,0), maybe the parent function is \(y = 2^x\) with a point at (0,1) (but the image has a dot at (0,0), maybe a mistake). Anyway, to graph \(y = 2^x + 1\), we take each point \((x, 2^x)\) on \(y = 2^x\) and move it up 1 unit to \((x, 2^x + 1)\).
So the key points after transformation:
- When \(x = 0\): \(y = 2^0 + 1 = 2\) → (0, 2)
- When \(x = 1\): \(y = 2^1 + 1 = 3\)? Wait, no, in the image, the points are at (0,2), (1,4), (2,8)? Wait, that would be \(y = 2^x\) shifted up by 1? No, \(2^x + 1\) at \(x=2\) is \(4 + 1 = 5\)? Wait, maybe the image is of \(y = 2^x\) and we need to shift up by 1. So the correct transformed points are:
For \(x = 0\): (0, 2)
For \(x = 1\): (1, 3)
For \(x = 2\): (2, 5)
For \(x = 3\): (3, 9)
But in the image, the points are at (0,2), (1,4), (2,8) – maybe the parent function in the image is \(y = 2^x\) (since \(2^0=1\), but the image has (0,0) as the origin, maybe a typo). Anyway, the transformation is vertical shift up by 1 unit.

Snap & solve any problem in the app
Get step-by-step solutions on Sovi AI
Photo-based solutions with guided steps
Explore more problems and detailed explanations
To graph \(y = 2^x + 1\), shift the graph of the parent function \(y = 2^x\) up by 1 unit. Key points of \(y = 2^x\) (e.g., \((0,1)\), \((1,2)\), \((2,4)\), \((3,8)\)) become \((0,2)\), \((1,3)\), \((2,5)\), \((3,9)\) after the shift. Plot these transformed points and draw the exponential curve through them.