QUESTION IMAGE
Question
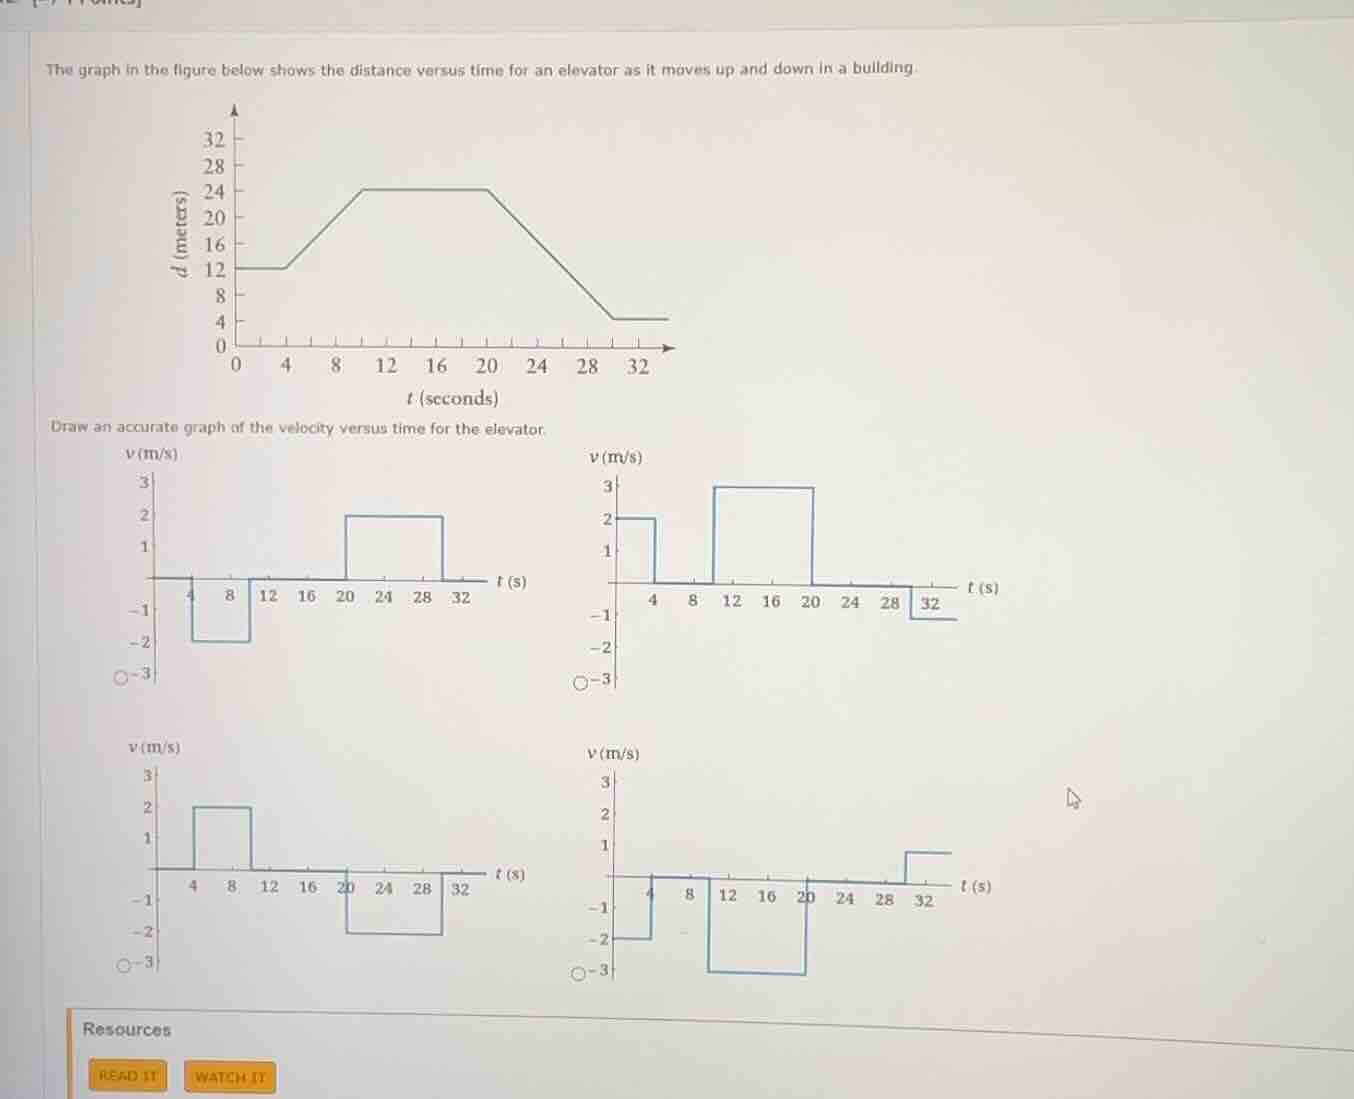
the graph in the figure below shows the distance versus time for an elevator as it moves up and down in a building.draw an accurate graph of the velocity versus time for the elevator.
Step1: Analyze first segment (0-6s)
Distance is constant, so velocity = 0.
$v = \frac{\Delta d}{\Delta t} = \frac{12-12}{6-0} = 0$ m/s
Step2: Analyze second segment (6-12s)
Distance increases from 12 to 24m.
$v = \frac{24-12}{12-6} = \frac{12}{6} = 2$ m/s
Step3: Analyze third segment (12-20s)
Distance is constant, so velocity = 0.
$v = \frac{24-24}{20-12} = 0$ m/s
Step4: Analyze fourth segment (20-30s)
Distance decreases from 24 to 4m.
$v = \frac{4-24}{30-20} = \frac{-20}{10} = -2$ m/s
Step5: Analyze fifth segment (30-32+s)
Distance is constant, so velocity = 0.
$v = \frac{4-4}{t_f-30} = 0$ m/s

Snap & solve any problem in the app
Get step-by-step solutions on Sovi AI
Photo-based solutions with guided steps
Explore more problems and detailed explanations
The correct velocity-time graph is the top-right option:
- 0 m/s from 0-6s, 2 m/s from 6-12s, 0 m/s from 12-20s, -2 m/s from 20-30s, 0 m/s after 30s.