QUESTION IMAGE
Question
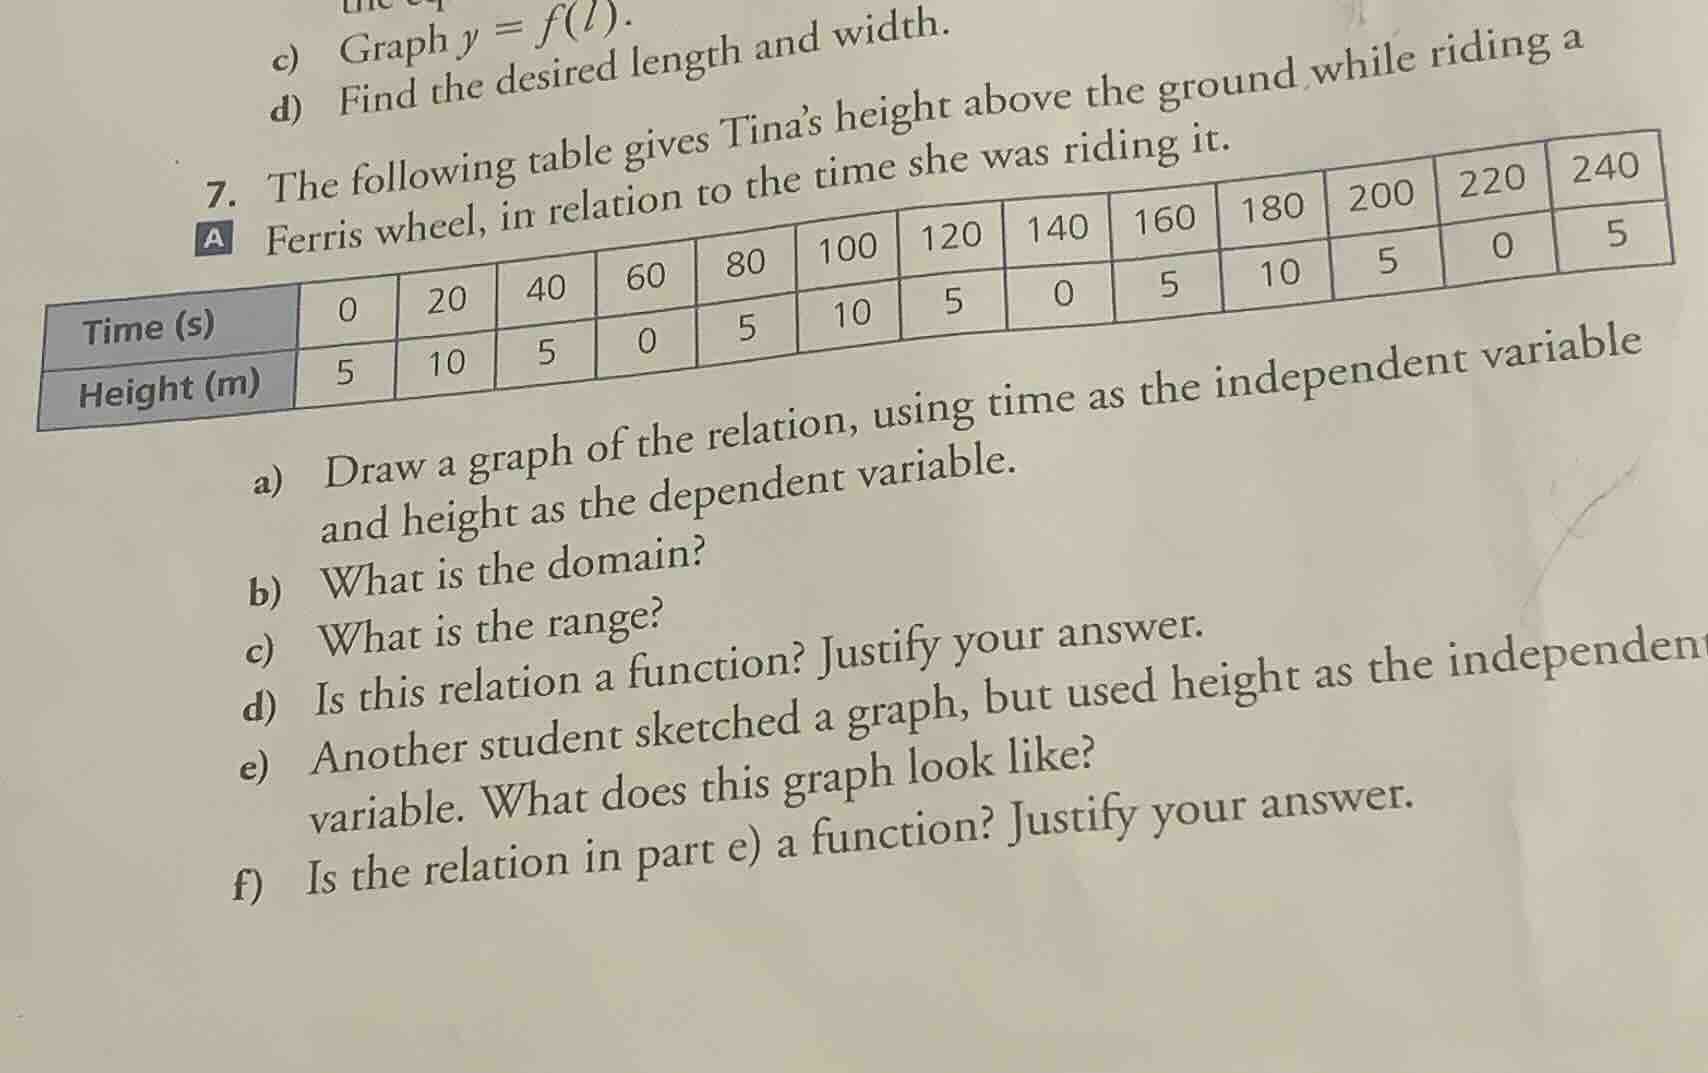
c) graph ( y = f(l) ).
d) find the desired length and width.
- the following table gives tina’s height above the ground while riding a ferris wheel, in relation to the time she was riding it.
| time (s) | 0 | 20 | 40 | 60 | 80 | 100 | 120 | 140 | 160 | 180 | 200 | 220 | 240 |
|---|
a) draw a graph of the relation, using time as the independent variable and height as the dependent variable.
b) what is the domain?
c) what is the range?
d) is this relation a function? justify your answer.
e) another student sketched a graph, but used height as the independent variable. what does this graph look like?
f) is the relation in part e) a function? justify your answer.
Part (a)
To draw the graph:
- Set up axes: Label the x - axis as "Time (s)" and the y - axis as "Height (m)".
- Plot points: Use the given table values. For example, when time \( t = 0\) s, height \( h=5\) m, so plot the point \((0,5)\); when \( t = 20\) s, \( h = 10\) m, plot \((20,10)\); when \( t=40\) s, \( h = 5\) m, plot \((40,5)\); when \( t = 60\) s, \( h=0\) m, plot \((60,0)\); when \( t = 80\) s, \( h = 5\) m, plot \((80,5)\); when \( t=100\) s, \( h = 10\) m, plot \((100,10)\); when \( t = 120\) s, \( h=5\) m, plot \((120,5)\); when \( t = 140\) s, \( h = 0\) m, plot \((140,0)\); when \( t=160\) s, \( h = 5\) m, plot \((160,5)\); when \( t = 180\) s, \( h=10\) m, plot \((180,10)\); when \( t = 200\) s, \( h = 5\) m, plot \((200,5)\); when \( t=220\) s, \( h = 0\) m, plot \((220,0)\); when \( t = 240\) s, \( h=5\) m, plot \((240,5)\).
- Connect points: Since the Ferris wheel motion is smooth (even though we have discrete time points), we can connect the plotted points with a smooth curve (it will resemble a sinusoidal - like curve, as Ferris wheel height vs time is a periodic function).
Part (b)
The domain of a relation is the set of all possible values of the independent variable. Here, the independent variable is time. From the table, the time values start at \( t = 0\) s and go up to \( t=240\) s. Also, since the Ferris wheel motion is continuous (we can assume that time can take any value between 0 and 240 seconds for this motion), the domain is \( 0\leq t\leq240\) (or in set notation \(\{t\in\mathbb{R}|0\leq t\leq240\}\), but from the table's context, we can also consider the discrete values, but for the relation representing the Ferris wheel height over time, the domain is the interval of time during which Tina is riding, so \( 0\leq t\leq240\) seconds.
Part (c)
The range of a relation is the set of all possible values of the dependent variable. Here, the dependent variable is height. From the table, the height values are \( 0\), \( 5\), and \( 10\) meters. By looking at the motion of the Ferris wheel, the height varies between \( 0\) m (lowest point) and \( 10\) m (highest point). So the range is \( 0\leq h\leq10\) (or \(\{h\in\mathbb{R}|0\leq h\leq10\}\), and the discrete values we see are \( 0\), \( 5\), \( 10\) which are within this interval).
Part (d)
A relation is a function if for every value of the independent variable (time, in this case), there is exactly one value of the dependent variable (height). Let's check the table: for each time value (0, 20, 40, …, 240), there is only one corresponding height value. For example, at \( t = 0\), \( h = 5\); at \( t=20\), \( h = 10\), and so on. There is no time value that has more than one height value associated with it. So, by the definition of a function, this relation is a function.
Part (e)
If we use height as the independent variable and time as the dependent variable, we will have the reverse of the graph in part (a). For each height value, we will have multiple time values. For example, when \( h = 5\) m, the time values are \( t = 0\), \( t = 40\), \( t = 80\), \( t = 120\), \( t = 160\), \( t = 200\), \( t = 240\); when \( h=10\) m, the time values are \( t = 20\), \( t = 100\), \( t = 180\); when \( h = 0\) m, the time values are \( t = 60\), \( t = 140\), \( t = 220\). So the graph will have vertical - like clusters (or multiple points) for each height value. For example, at \( h = 5\), we will have points \((5,0)\), \((5,40)\), \((5,80)\), \((5,120)\), \((5,160)\), \((5,200)\), \((5,240)\); at \( h = 10\), points \((1…

Snap & solve any problem in the app
Get step-by-step solutions on Sovi AI
Photo-based solutions with guided steps
Explore more problems and detailed explanations
Part (a)
To draw the graph:
- Set up axes: Label the x - axis as "Time (s)" and the y - axis as "Height (m)".
- Plot points: Use the given table values. For example, when time \( t = 0\) s, height \( h=5\) m, so plot the point \((0,5)\); when \( t = 20\) s, \( h = 10\) m, plot \((20,10)\); when \( t=40\) s, \( h = 5\) m, plot \((40,5)\); when \( t = 60\) s, \( h=0\) m, plot \((60,0)\); when \( t = 80\) s, \( h = 5\) m, plot \((80,5)\); when \( t=100\) s, \( h = 10\) m, plot \((100,10)\); when \( t = 120\) s, \( h=5\) m, plot \((120,5)\); when \( t = 140\) s, \( h = 0\) m, plot \((140,0)\); when \( t=160\) s, \( h = 5\) m, plot \((160,5)\); when \( t = 180\) s, \( h=10\) m, plot \((180,10)\); when \( t = 200\) s, \( h = 5\) m, plot \((200,5)\); when \( t=220\) s, \( h = 0\) m, plot \((220,0)\); when \( t = 240\) s, \( h=5\) m, plot \((240,5)\).
- Connect points: Since the Ferris wheel motion is smooth (even though we have discrete time points), we can connect the plotted points with a smooth curve (it will resemble a sinusoidal - like curve, as Ferris wheel height vs time is a periodic function).
Part (b)
The domain of a relation is the set of all possible values of the independent variable. Here, the independent variable is time. From the table, the time values start at \( t = 0\) s and go up to \( t=240\) s. Also, since the Ferris wheel motion is continuous (we can assume that time can take any value between 0 and 240 seconds for this motion), the domain is \( 0\leq t\leq240\) (or in set notation \(\{t\in\mathbb{R}|0\leq t\leq240\}\), but from the table's context, we can also consider the discrete values, but for the relation representing the Ferris wheel height over time, the domain is the interval of time during which Tina is riding, so \( 0\leq t\leq240\) seconds.
Part (c)
The range of a relation is the set of all possible values of the dependent variable. Here, the dependent variable is height. From the table, the height values are \( 0\), \( 5\), and \( 10\) meters. By looking at the motion of the Ferris wheel, the height varies between \( 0\) m (lowest point) and \( 10\) m (highest point). So the range is \( 0\leq h\leq10\) (or \(\{h\in\mathbb{R}|0\leq h\leq10\}\), and the discrete values we see are \( 0\), \( 5\), \( 10\) which are within this interval).
Part (d)
A relation is a function if for every value of the independent variable (time, in this case), there is exactly one value of the dependent variable (height). Let's check the table: for each time value (0, 20, 40, …, 240), there is only one corresponding height value. For example, at \( t = 0\), \( h = 5\); at \( t=20\), \( h = 10\), and so on. There is no time value that has more than one height value associated with it. So, by the definition of a function, this relation is a function.
Part (e)
If we use height as the independent variable and time as the dependent variable, we will have the reverse of the graph in part (a). For each height value, we will have multiple time values. For example, when \( h = 5\) m, the time values are \( t = 0\), \( t = 40\), \( t = 80\), \( t = 120\), \( t = 160\), \( t = 200\), \( t = 240\); when \( h=10\) m, the time values are \( t = 20\), \( t = 100\), \( t = 180\); when \( h = 0\) m, the time values are \( t = 60\), \( t = 140\), \( t = 220\). So the graph will have vertical - like clusters (or multiple points) for each height value. For example, at \( h = 5\), we will have points \((5,0)\), \((5,40)\), \((5,80)\), \((5,120)\), \((5,160)\), \((5,200)\), \((5,240)\); at \( h = 10\), points \((10,20)\), \((10,100)\), \((10,180)\); at \( h = 0\), points \((0,60)\), \((0,140)\), \((0,220)\). So the graph will have horizontal segments (or multiple points) for each height, showing that for a single height, there are multiple times.
Part (f)
A relation is a function if for every value of the independent variable (height, in this case), there is exactly one value of the dependent variable (time). But when \( h = 5\) m, there are multiple time values (\( t = 0\), \( t = 40\), \( t = 80\), etc.). Similarly, for \( h=10\) m, there are multiple time values (\( t = 20\), \( t = 100\), \( t = 180\)) and for \( h = 0\) m, multiple time values (\( t = 60\), \( t = 140\), \( t = 220\)). So, since there are height values (independent variable) that have more than one time value (dependent variable) associated with them, this relation is not a function.