QUESTION IMAGE
Question
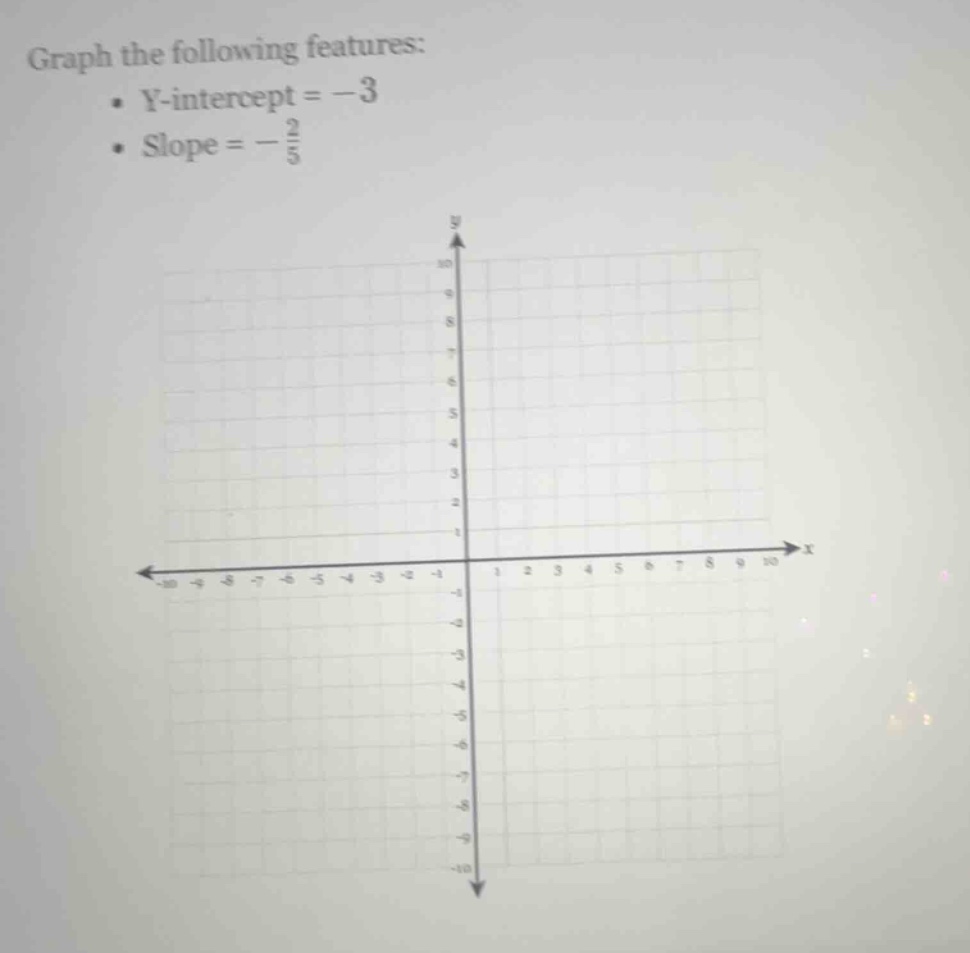
graph the following features: • y-intercept = -3 • slope = -2/5
Step1: Plot the y - intercept
The y - intercept is the point where the line crosses the y - axis. Given that the y - intercept is - 3, we plot the point (0, - 3) on the coordinate plane.
Step2: Use the slope to find another point
The slope of a line is given by the formula $m=\frac{\text{rise}}{\text{run}}$. Here, the slope $m =-\frac{2}{5}$. The negative sign indicates a decrease (fall) in the y - value as the x - value increases. The numerator (rise) is - 2 (which means we go down 2 units) and the denominator (run) is 5 (which means we go right 5 units) from the y - intercept point (0, - 3).
Starting from (0, - 3), moving down 2 units (so the y - coordinate becomes - 3-2=-5) and moving right 5 units (so the x - coordinate becomes 0 + 5=5), we get the point (5, - 5). We can also use the positive - negative combination of rise and run. If we take rise = 2 and run=-5 (go up 2 units and left 5 units), starting from (0, - 3), moving up 2 units (y - coordinate=-3 + 2=-1) and left 5 units (x - coordinate=0-5=-5), we get the point (-5, - 1).
Step3: Draw the line
After plotting the y - intercept (0, - 3) and at least one other point (e.g., (5, - 5) or (-5, - 1)), we draw a straight line passing through these points.
(Note: Since this is a graphing problem, the final answer is the graph with the line passing through (0, - 3) and other points determined by the slope. But in terms of the steps to graph, the above steps are followed.)

Snap & solve any problem in the app
Get step-by-step solutions on Sovi AI
Photo-based solutions with guided steps
Explore more problems and detailed explanations
The graph is a straight line passing through the point \((0, - 3)\) and other points such as \((5, - 5)\) (or \((-5, - 1)\)) with a slope of \(-\frac{2}{5}\). To visualize, plot \((0, - 3)\) on the y - axis, then use the slope to find additional points and draw a line through them.