QUESTION IMAGE
Question
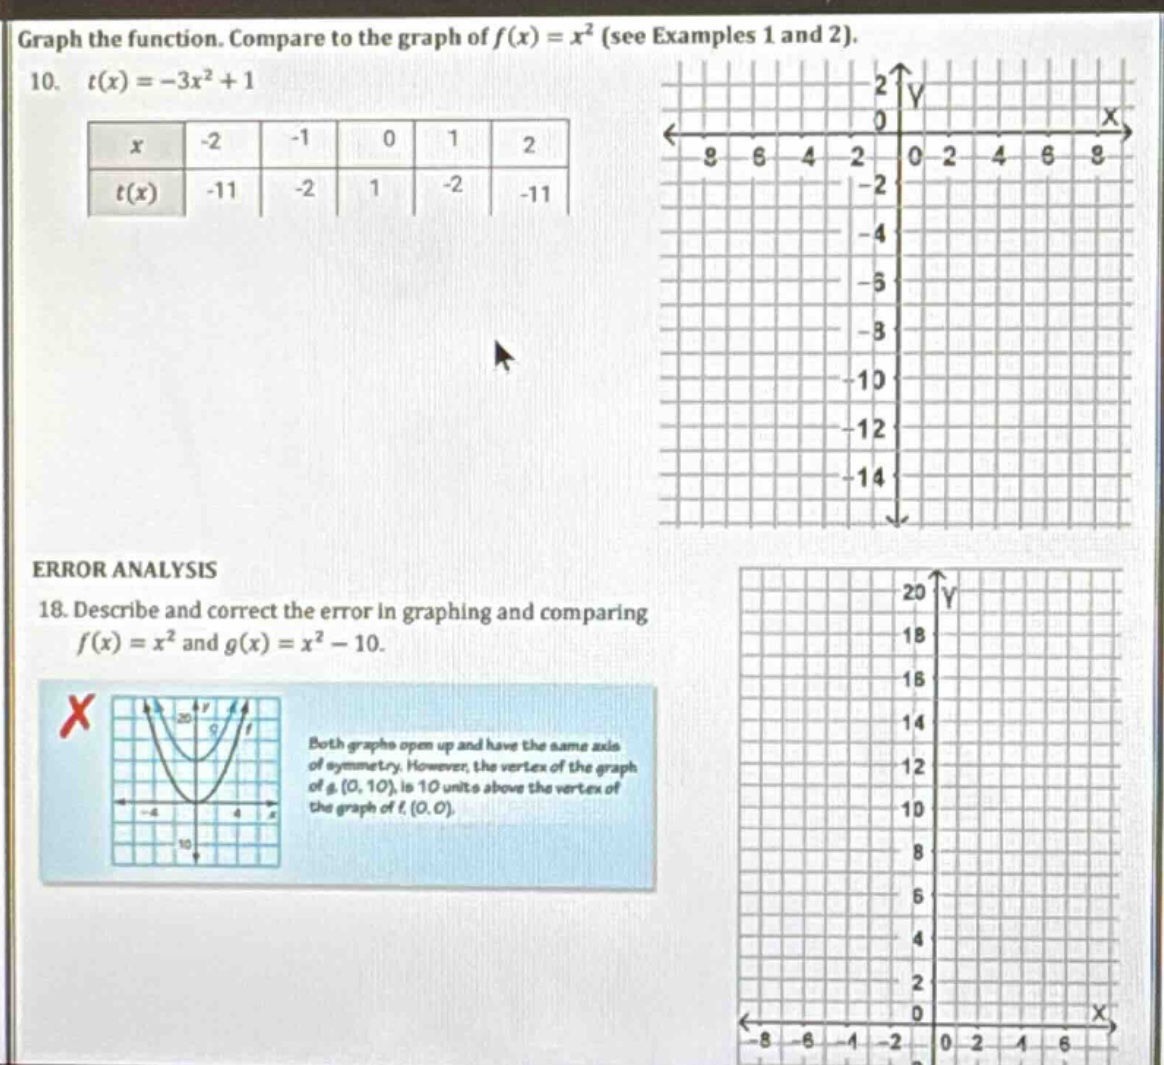
graph the function. compare to the graph of $f(x) = x^2$ (see examples 1 and 2).
- $t(x) = -3x^2 + 1$
| $x$ | -2 | -1 | 0 | 1 | 2 |
| $t(x)$ | -11 | -2 | 1 | -2 | -11 |
error analysis
- describe and correct the error in graphing and comparing $f(x) = x^2$ and $g(x) = x^2 - 10$.
image of incorrect graph and analysis with a red x
both graphs open up and have the same axis of symmetry. however, the vertex of the graph of $g$, $(0, 10)$, is 10 units above the vertex of the graph of $f$, $(0, 0)$.
For Problem 10:
Step1: Plot given points
Plot $(x, t(x))$: $(-2,-11), (-1,-2), (0,1), (1,-2), (2,-11)$
Step2: Draw parabola through points
Connect points smoothly to form $t(x)=-3x^2+1$
Step3: Compare to $f(x)=x^2$
- $f(x)=x^2$ opens up; $t(x)$ opens down (negative leading coefficient).
- $t(x)$ is vertically stretched by factor 3.
- $t(x)$ is shifted up 1 unit from $f(x)$.
The error is in the direction of the vertical shift. For $g(x)=x^2 - 10$, subtracting 10 from the parent function $f(x)=x^2$ results in a downward vertical shift, not upward. The vertex of $g(x)$ is $(0,-10)$, which is 10 units below the vertex of $f(x)$ at $(0,0)$.

Snap & solve any problem in the app
Get step-by-step solutions on Sovi AI
Photo-based solutions with guided steps
Explore more problems and detailed explanations
The graph of $t(x) = -3x^2 + 1$ is a downward-opening parabola with vertex at $(0,1)$, vertically stretched by a factor of 3 compared to $f(x)=x^2$, and shifted 1 unit upward. The plotted points form this parabola as described.
---