QUESTION IMAGE
Question
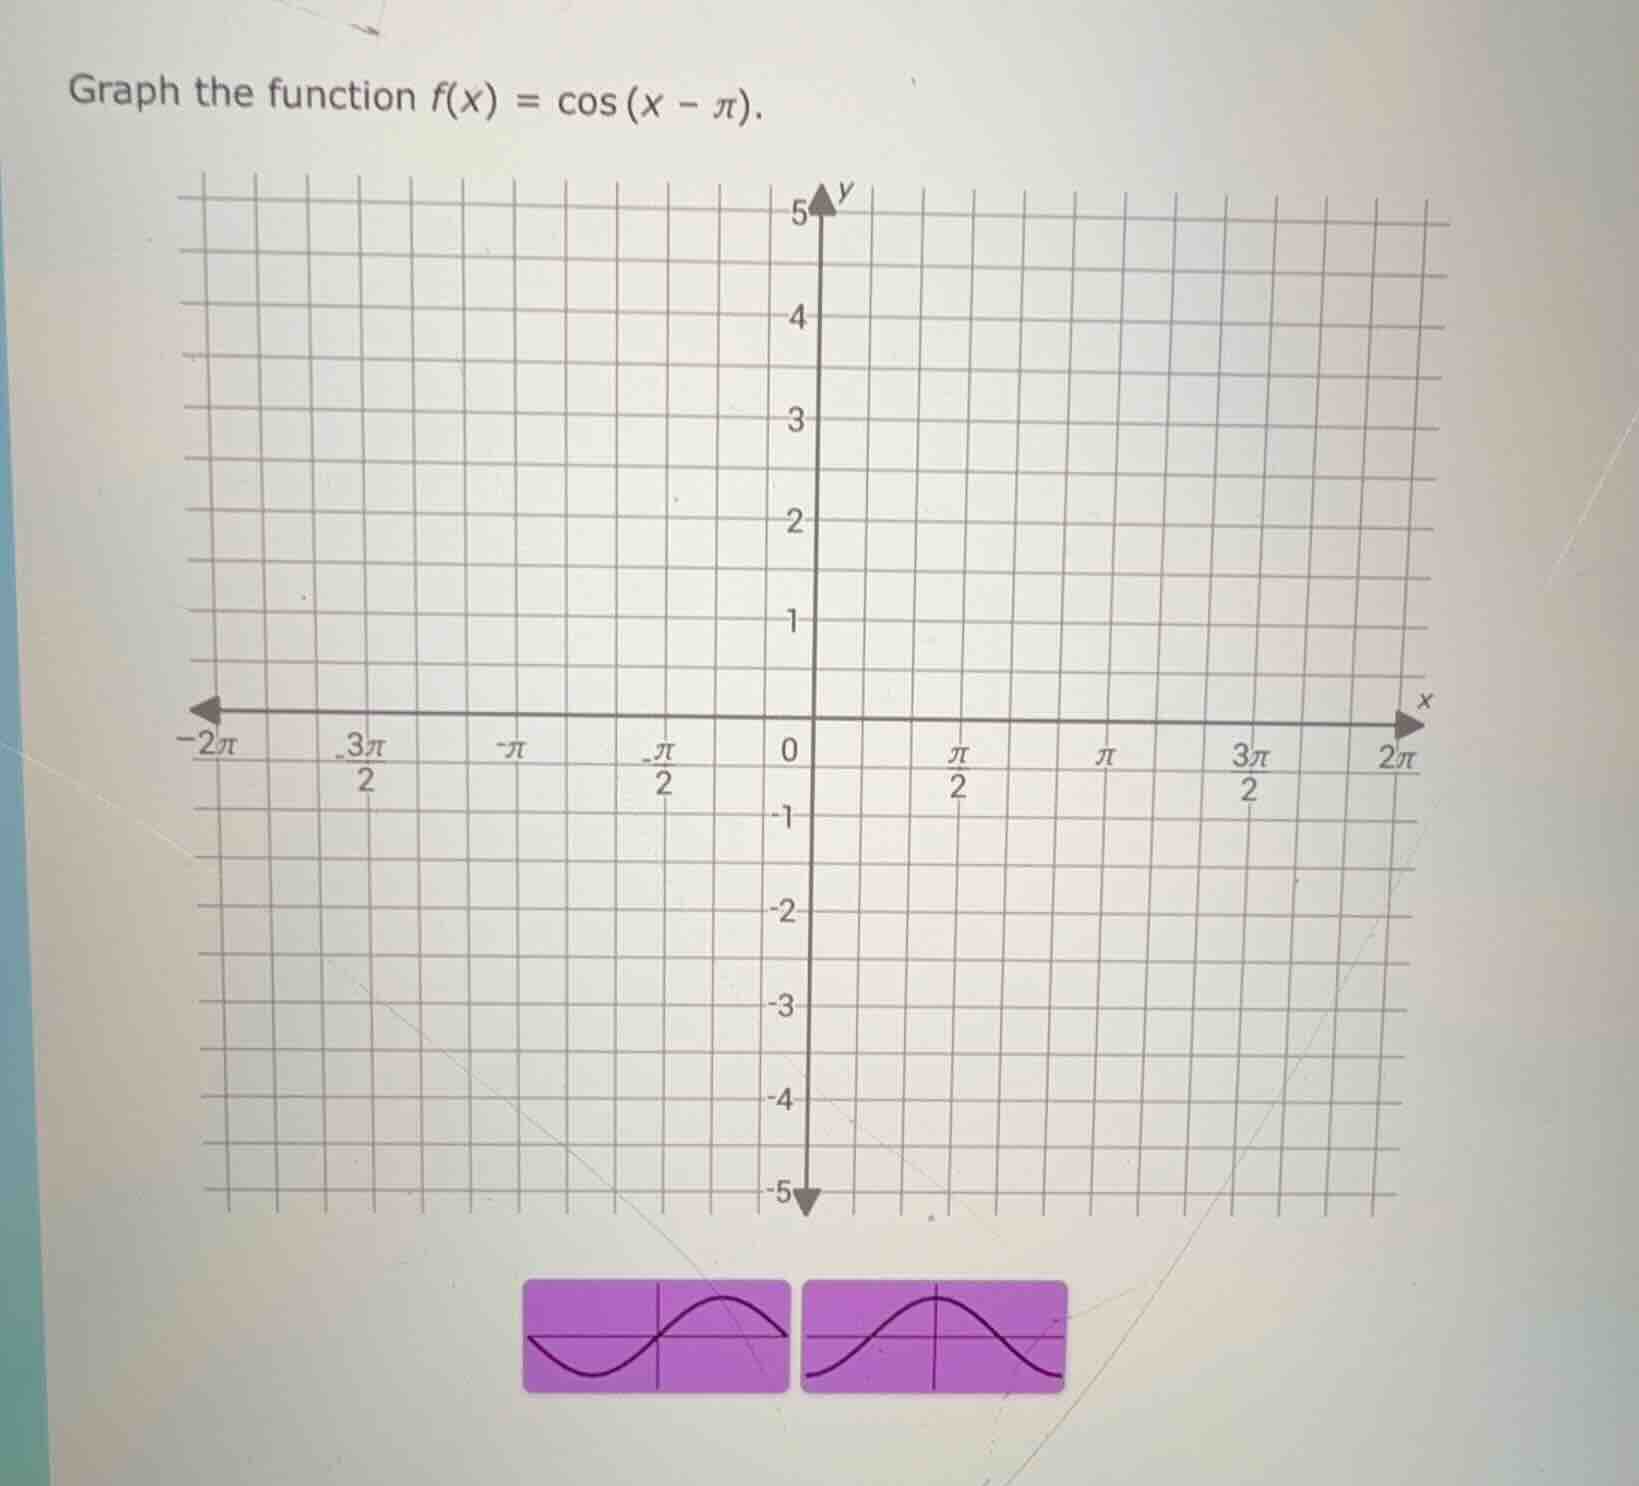
graph the function f(x) = cos(x - π).
Step1: Simplify the function
Using the cosine subtraction formula $\cos(A - B)=\cos A\cos B+\sin A\sin B$, for $f(x)=\cos(x - \pi)$, we have $A = x$, $B=\pi$. So $\cos(x-\pi)=\cos x\cos\pi+\sin x\sin\pi$. Since $\cos\pi=- 1$ and $\sin\pi = 0$, then $f(x)=-\cos x$.
Step2: Recall the graph of $y = \cos x$
The graph of $y=\cos x$ has a period of $2\pi$, amplitude $1$, maximum value $1$ at $x = 2k\pi$ ($k\in\mathbb{Z}$), minimum value $- 1$ at $x=(2k + 1)\pi$ ($k\in\mathbb{Z}$), and passes through $(0,1),(\frac{\pi}{2},0),(\pi,-1),(\frac{3\pi}{2},0),(2\pi,1)$ etc.
Step3: Analyze the graph of $y=-\cos x$
The graph of $y =-\cos x$ is a reflection of the graph of $y=\cos x$ over the $x$-axis. So the key points of $y =-\cos x$ will be: at $x = 0$, $y=-\cos(0)=- 1$; at $x=\frac{\pi}{2}$, $y =-\cos(\frac{\pi}{2})=0$; at $x=\pi$, $y=-\cos(\pi)=1$; at $x=\frac{3\pi}{2}$, $y=-\cos(\frac{3\pi}{2})=0$; at $x = 2\pi$, $y=-\cos(2\pi)=-1$.
To graph $f(x)=\cos(x - \pi)=-\cos x$:
- Start by plotting the key points: $(0,-1),(\frac{\pi}{2},0),(\pi,1),(\frac{3\pi}{2},0),(2\pi,-1)$ and their counterparts in the negative $x$-direction (using the periodicity of period $2\pi$).
- Then draw a smooth curve connecting these points, which will be a cosine - shaped curve reflected over the $x$-axis, with amplitude $1$ and period $2\pi$.
(Note: Since the problem asks to graph the function, the final answer is the graph of $y =-\cos x$ which can be plotted using the key points and the shape of the cosine curve after reflection. If we were to describe the graph in relation to the given grid, we can plot the points as calculated and draw the curve. For example, at $x = 0$, the point is $(0,-1)$; at $x=\pi$, the point is $(\pi,1)$; at $x = 2\pi$, the point is $(2\pi,-1)$ etc. and connect them with a smooth wave - like curve.)

Snap & solve any problem in the app
Get step-by-step solutions on Sovi AI
Photo-based solutions with guided steps
Explore more problems and detailed explanations
The graph of $f(x)=\cos(x - \pi)$ (which is equivalent to $y =-\cos x$) is a cosine - shaped curve with amplitude $1$, period $2\pi$, passing through points like $(0,-1),(\frac{\pi}{2},0),(\pi,1),(\frac{3\pi}{2},0),(2\pi,-1)$ (and symmetric points for negative $x$) and is a reflection of the graph of $y = \cos x$ over the $x$-axis. To draw it on the given grid, plot the key points and draw a smooth curve connecting them.