QUESTION IMAGE
Question
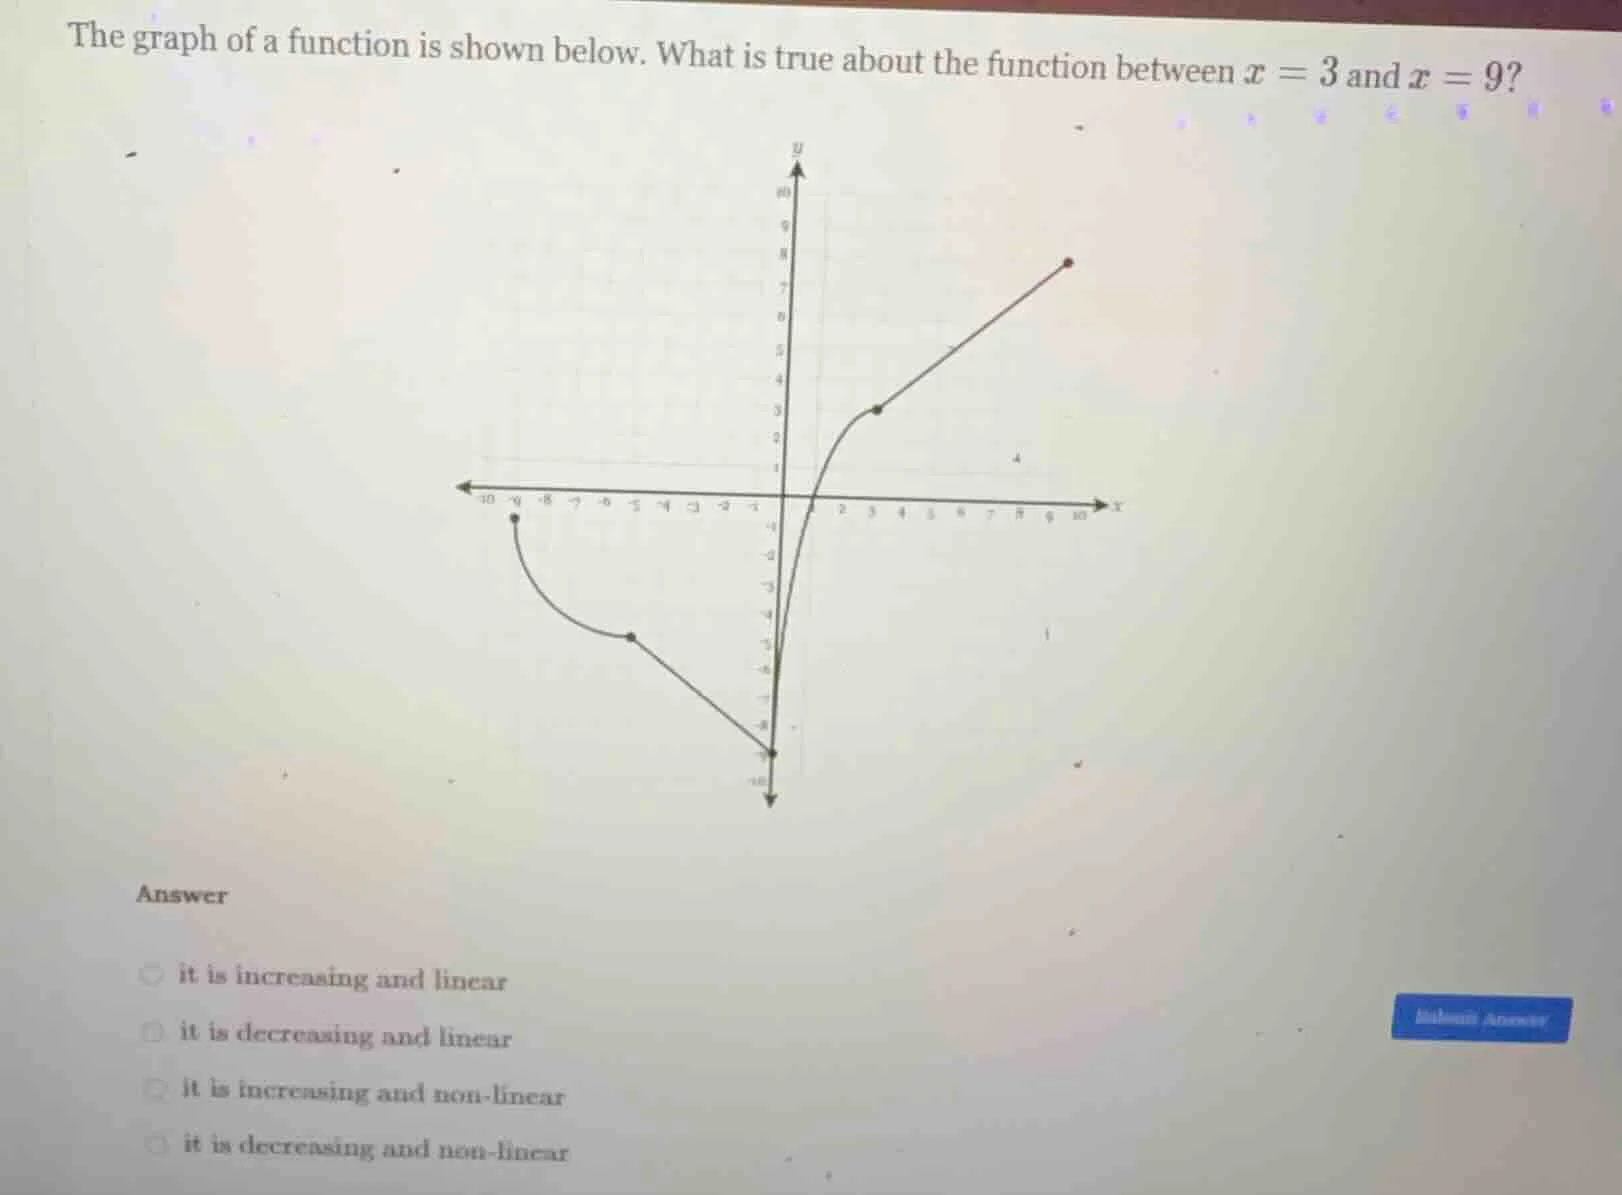
the graph of a function is shown below. what is true about the function between $x=3$ and $x=9$?
answer
it is increasing and linear
it is decreasing and linear
it is increasing and non-linear
it is decreasing and non-linear
Step1: Check trend (x=3 to x=9)
As $x$ increases from 3 to 9, the $y$-values of the function rise.
Step2: Check linearity (x=3 to x=9)
The segment between $x=3$ and $x=9$ is a straight line, so it has a constant slope and is linear.

Snap & solve any problem in the app
Get step-by-step solutions on Sovi AI
Photo-based solutions with guided steps
Explore more problems and detailed explanations
it is increasing and linear