QUESTION IMAGE
Question
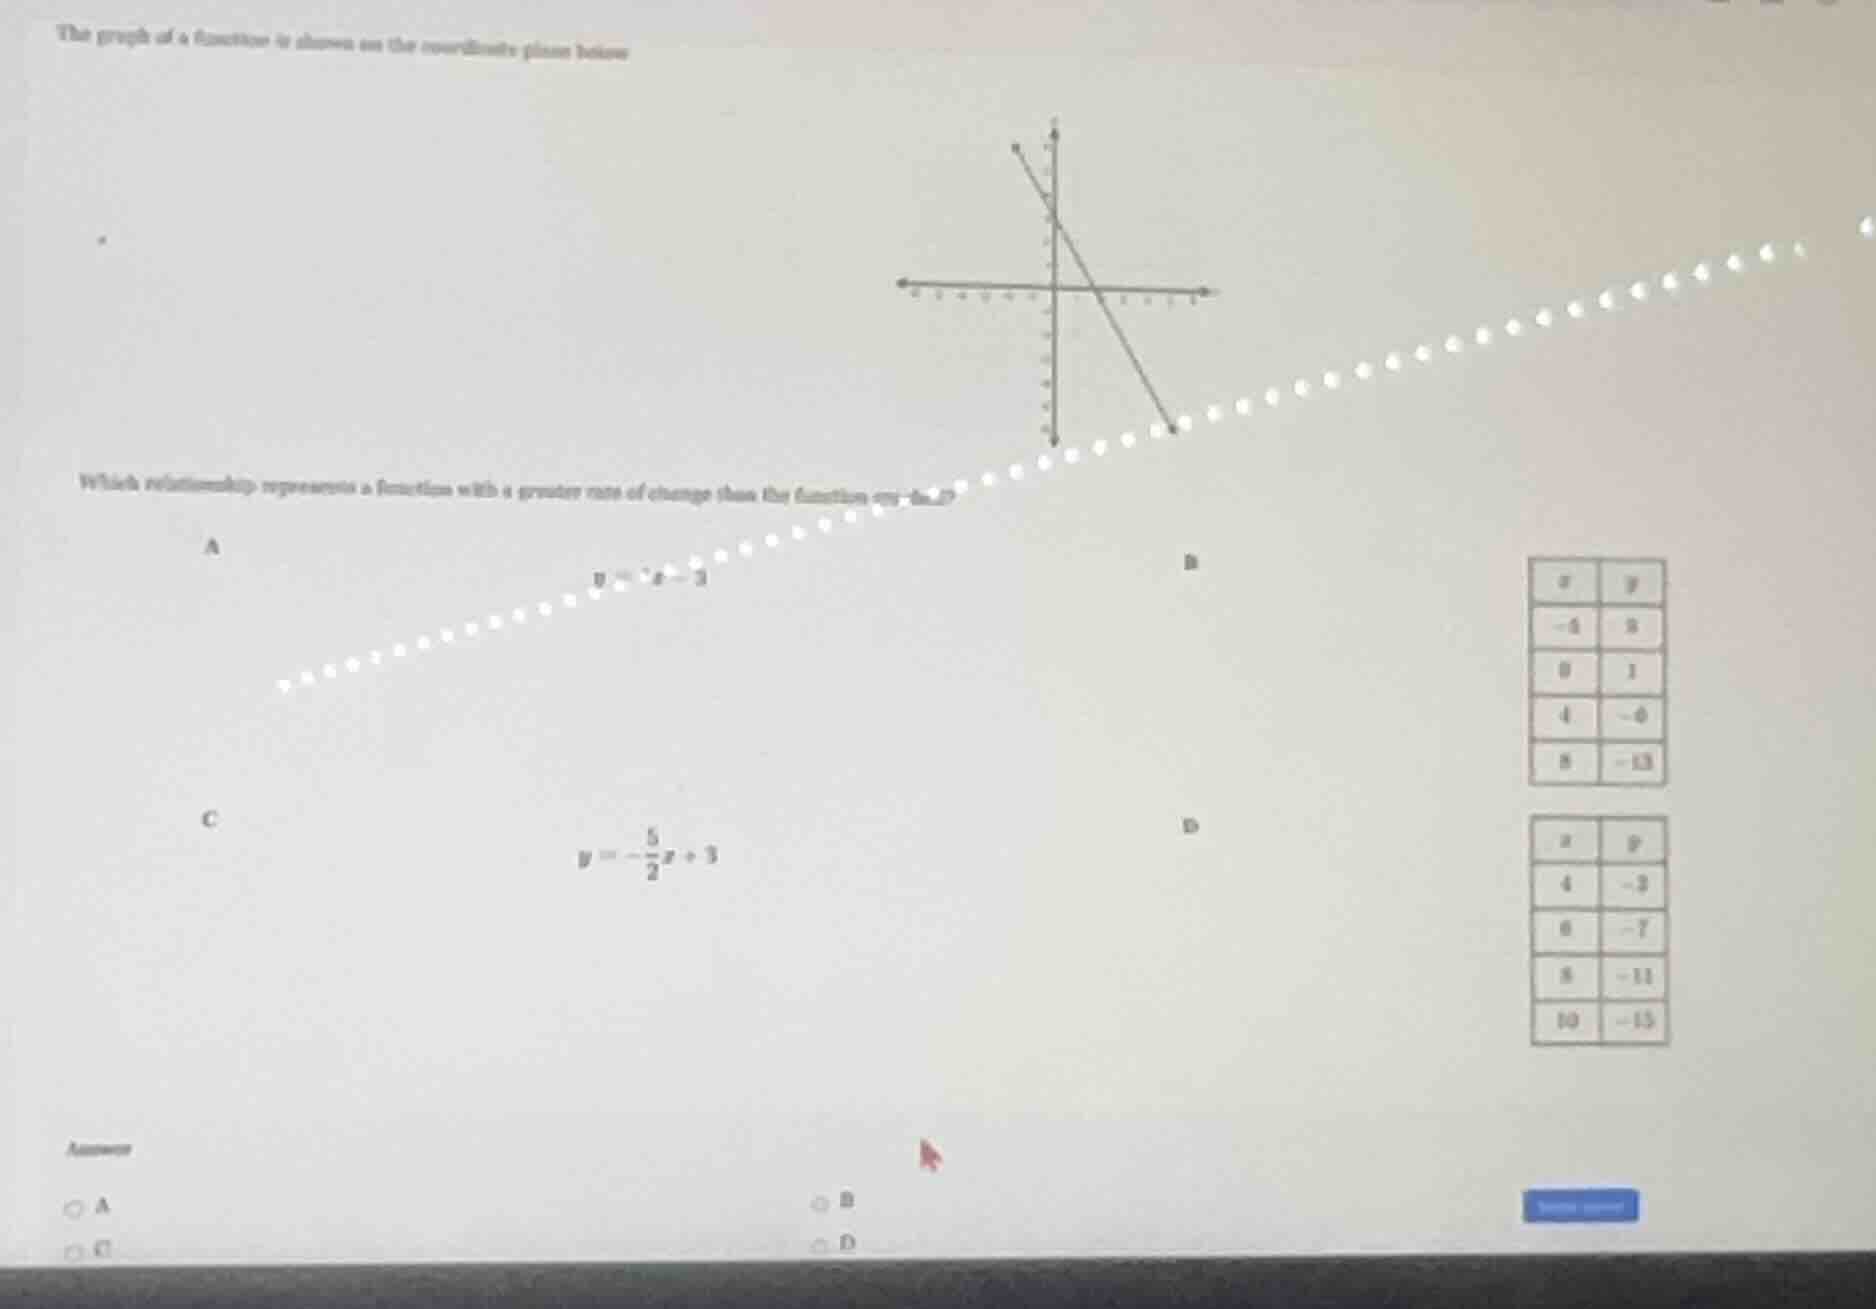
the graph of a function is shown on the coordinate plane below. which relationship represents a function with a greater rate of change than the function on the graph? a: $y = -2x - 3$; b: (table with x: -4, 0, 4, 8 and y: 8, 1, -6, -13); c: $y = -\frac{5}{2}x + 3$; d: (table with x: 4, 6, 8, 10 and y: -3, -7, -11, -15). answer choices: a, b, c, d
Step1: Find slope of graphed function
Identify two points on the line: (0, 3) and (2, -1). Use slope formula $m=\frac{y_2-y_1}{x_2-x_1}$.
$m=\frac{-1-3}{2-0}=\frac{-4}{2}=-2$
The rate of change is $-2$; we compare absolute values for "greater rate of change".
Step2: Calculate slope for Option A
Equation is $y=-x-3$, slope $m_A=-1$.
$|m_A|=1$
Step3: Calculate slope for Option B
Use table points (-4, 5) and (0,1).
$m_B=\frac{1-5}{0-(-4)}=\frac{-4}{4}=-1$
$|m_B|=1$
Step4: Calculate slope for Option C
Equation is $y=-\frac{5}{2}x+3$, slope $m_C=-\frac{5}{2}=-2.5$.
$|m_C|=2.5$
Step5: Calculate slope for Option D
Use table points (4,-3) and (6,-7).
$m_D=\frac{-7-(-3)}{6-4}=\frac{-4}{2}=-2$
$|m_D|=2$
Step6: Compare absolute slopes
$2.5>2>1$, so Option C has a greater rate of change.

Snap & solve any problem in the app
Get step-by-step solutions on Sovi AI
Photo-based solutions with guided steps
Explore more problems and detailed explanations
C. $y=-\frac{5}{2}x+3$