QUESTION IMAGE
Question
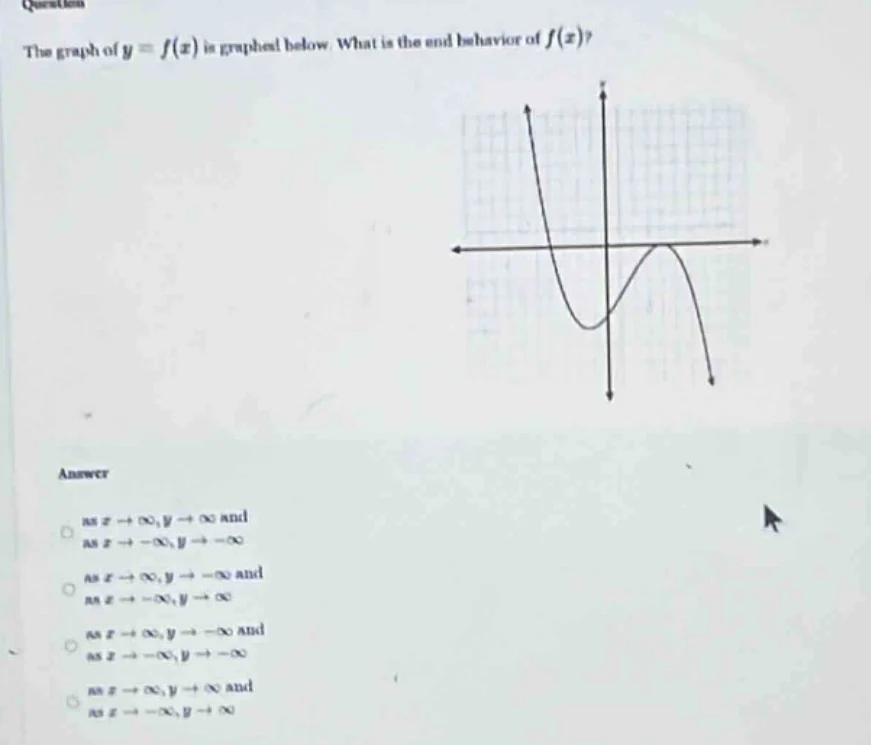
the graph of ( y = f(x) ) is graphed below. what is the end behavior of ( f(x) )?
answer
- as ( x \to +infty ), ( y \to +infty ) and as ( x \to -infty ), ( y \to -infty )
- as ( x \to +infty ), ( y \to -infty ) and as ( x \to -infty ), ( y \to +infty )
- as ( x \to +infty ), ( y \to -infty ) and as ( x \to -infty ), ( y \to -infty )
- as ( x \to +infty ), ( y \to +infty ) and as ( x \to -infty ), ( y \to +infty )
Step1: Analyze right end behavior
As $x \to +\infty$, the graph of $f(x)$ moves downward, so $y \to -\infty$.
Step2: Analyze left end behavior
As $x \to -\infty$, the graph of $f(x)$ moves upward, so $y \to +\infty$.

Snap & solve any problem in the app
Get step-by-step solutions on Sovi AI
Photo-based solutions with guided steps
Explore more problems and detailed explanations
as $x \to \infty, y \to -\infty$ and as $x \to -\infty, y \to \infty$