QUESTION IMAGE
Question
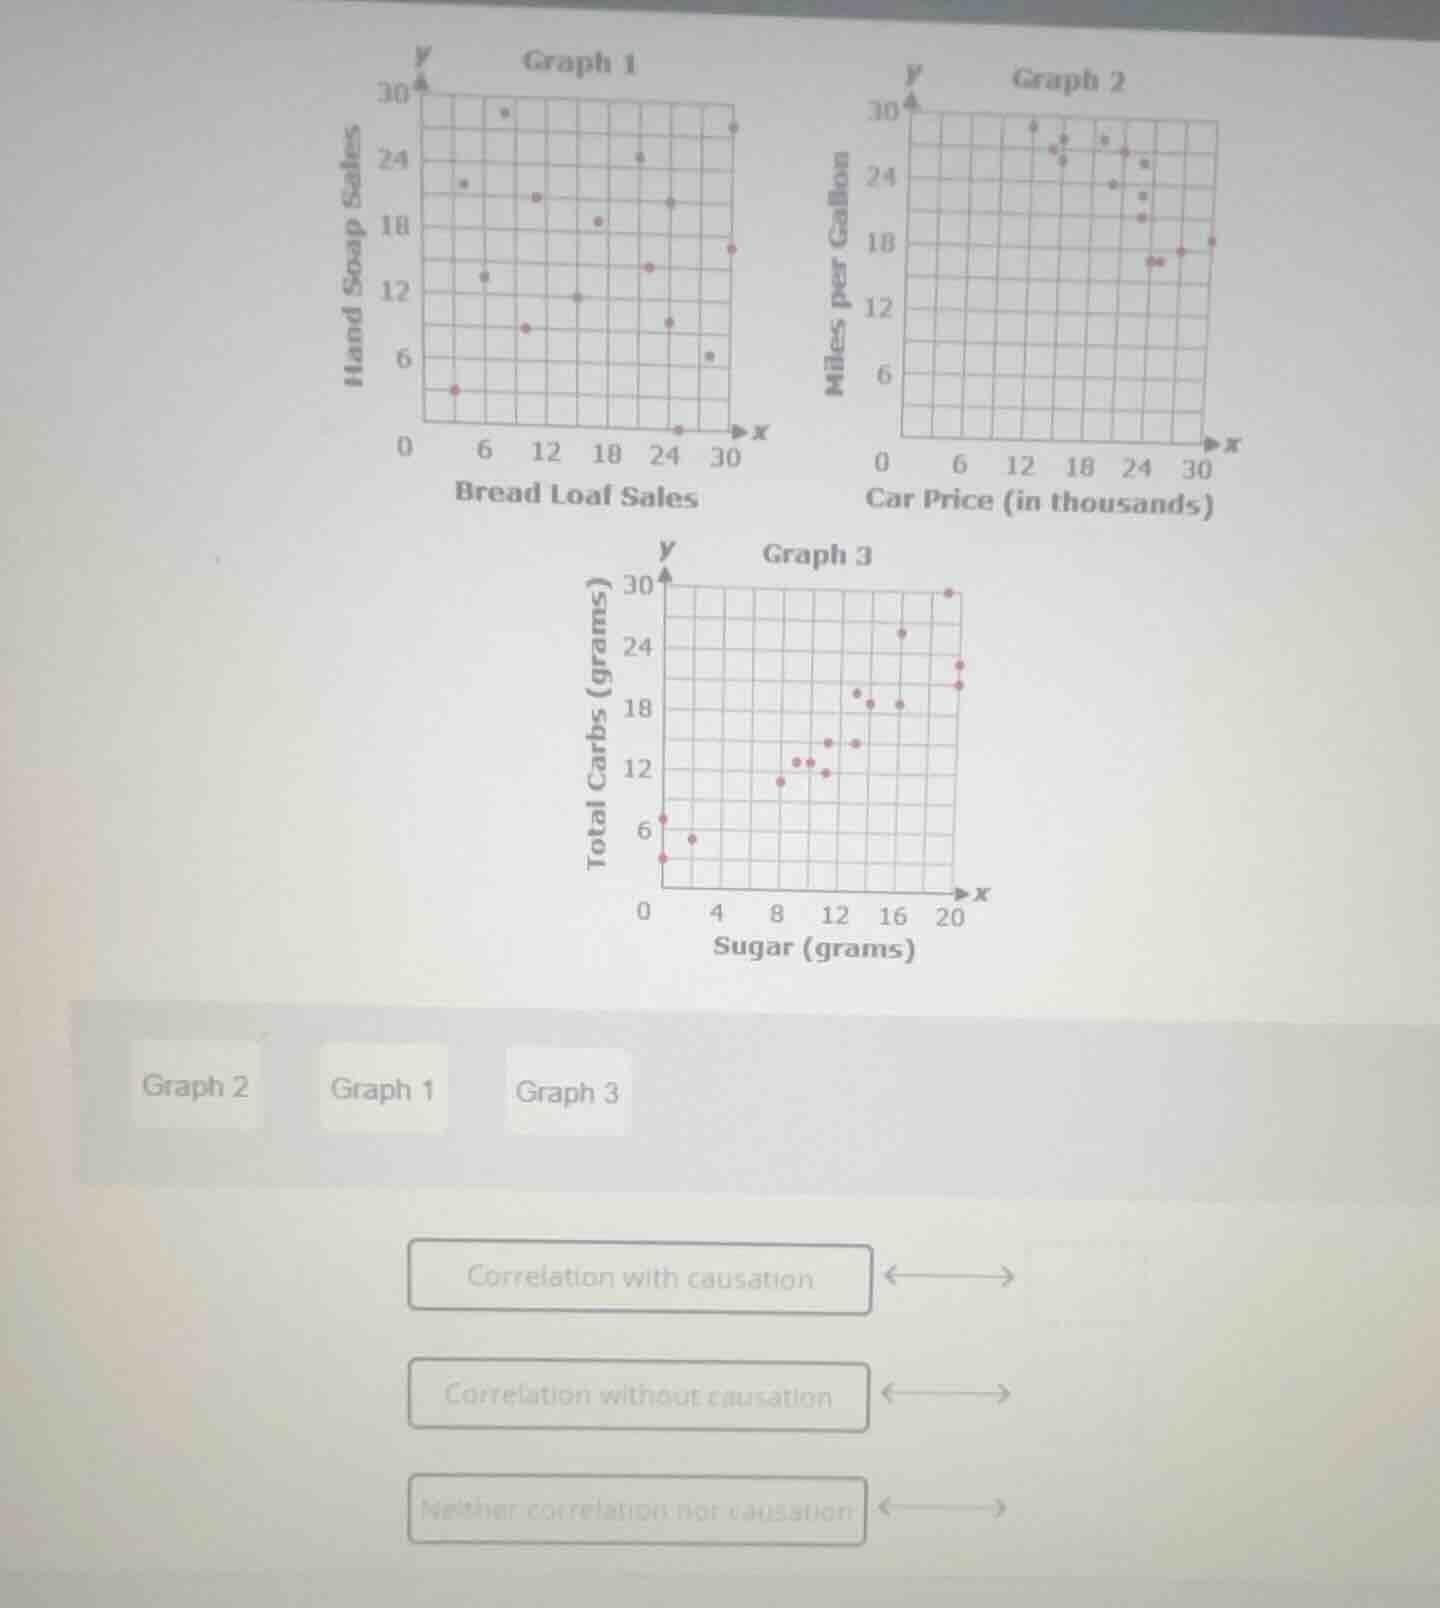
graph 1
hand soap sales
bread loaf sales
graph 2
miles per gallon
car price (in thousands)
graph 3
total carbs (grams)
sugar (grams)
graph 2 graph 1 graph 3
correlation with causation
correlation without causation
neither correlation nor causation
Brief Explanations
- Graph 1: The points are scattered randomly with no clear upward or downward trend, so there is no correlation between bread loaf sales and hand soap sales, meaning neither correlation nor causation exists.
- Graph 2: The points show a clear downward trend (as car price increases, miles per gallon decreases), so there is a correlation. However, a higher car price does not directly cause lower fuel efficiency; it is likely a coincidence of vehicle design choices, so this is correlation without causation.
- Graph 3: The points show a clear upward trend (as sugar content increases, total carbs increase). Since sugar is a type of carbohydrate, more sugar directly causes an increase in total carbs, so this is correlation with causation.

Snap & solve any problem in the app
Get step-by-step solutions on Sovi AI
Photo-based solutions with guided steps
Explore more problems and detailed explanations
- Graph 1 ↔ Neither correlation nor causation
- Graph 2 ↔ Correlation without causation
- Graph 3 ↔ Correlation with causation