QUESTION IMAGE
Question
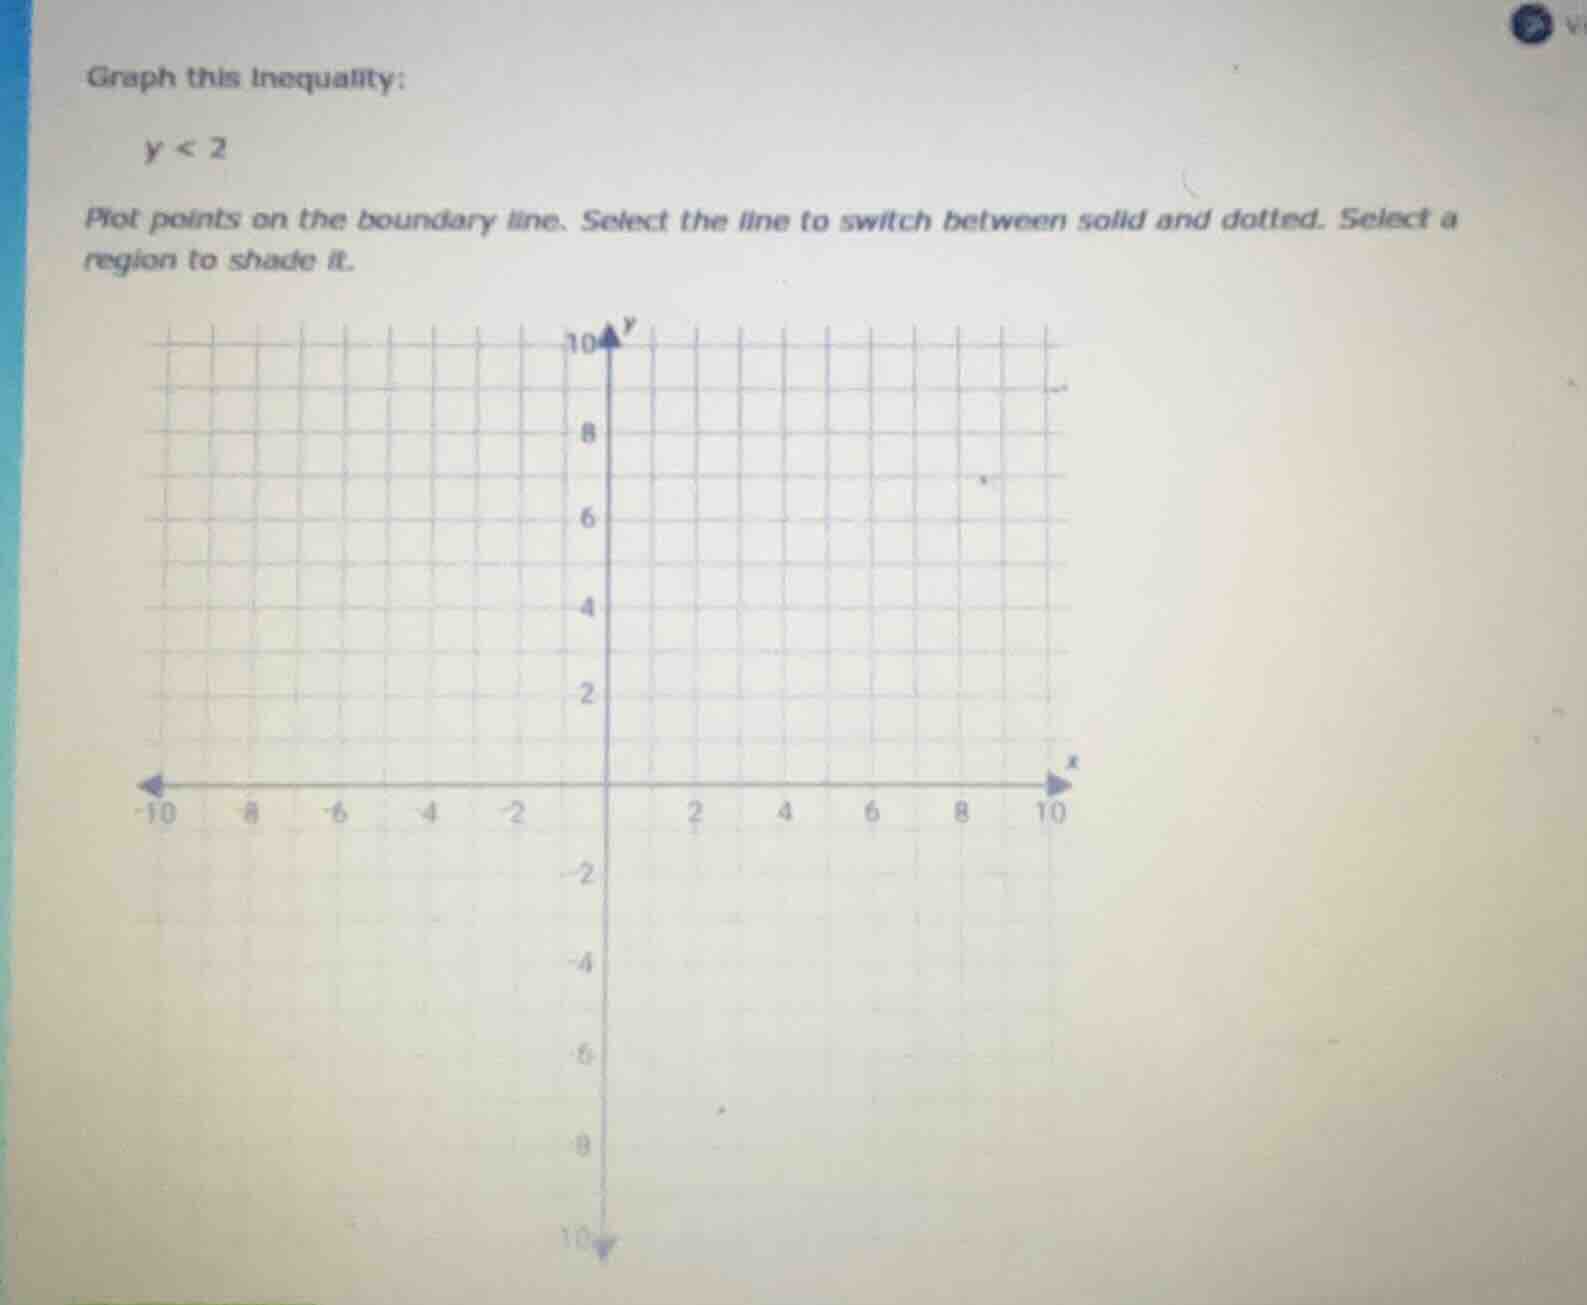
graph this inequality:
y < 2
plot points on the boundary line. select the line to switch between solid and dotted. select a region to shade it.
Step1: Identify the boundary line
The inequality is \( y < 2 \). The boundary line is \( y = 2 \), which is a horizontal line parallel to the x - axis passing through \( (x,2) \) for all \( x \). Since the inequality is strict (\( < \), not \( \leq \)), the boundary line should be a dotted line.
Step2: Plot points on the boundary line
We can choose several x - values and find the corresponding y - value (which is 2). For example, when \( x = - 10 \), \( y = 2 \); when \( x = 0 \), \( y = 2 \); when \( x = 10 \), \( y = 2 \). Plot these points \((-10,2)\), \((0,2)\), \((10,2)\) (and other points if needed) on the graph.
Step3: Determine the region to shade
To find which region to shade, we can test a point not on the boundary line. Let's test the point \((0,0)\). Substitute \( x = 0 \) and \( y = 0 \) into the inequality \( y<2 \). We get \( 0 < 2 \), which is true. So the region containing the point \((0,0)\) (the region below the line \( y = 2 \)) should be shaded.
To graph \( y < 2 \):
- Draw a dotted horizontal line \( y = 2 \) (since the inequality is strict, points on the line are not included in the solution set). You can plot points like \((-10,2)\), \((0,2)\), \((10,2)\) (and more) to form this line.
- Shade the region below the line \( y = 2 \) (this region contains all points where the y - coordinate is less than 2, as verified by testing the point \((0,0)\)).

Snap & solve any problem in the app
Get step-by-step solutions on Sovi AI
Photo-based solutions with guided steps
Explore more problems and detailed explanations
- Boundary line: Dotted horizontal line \( y = 2 \) with points like \((-10,2)\), \((0,2)\), \((10,2)\) plotted.
- Shaded region: The region below the line \( y = 2 \).