QUESTION IMAGE
Question
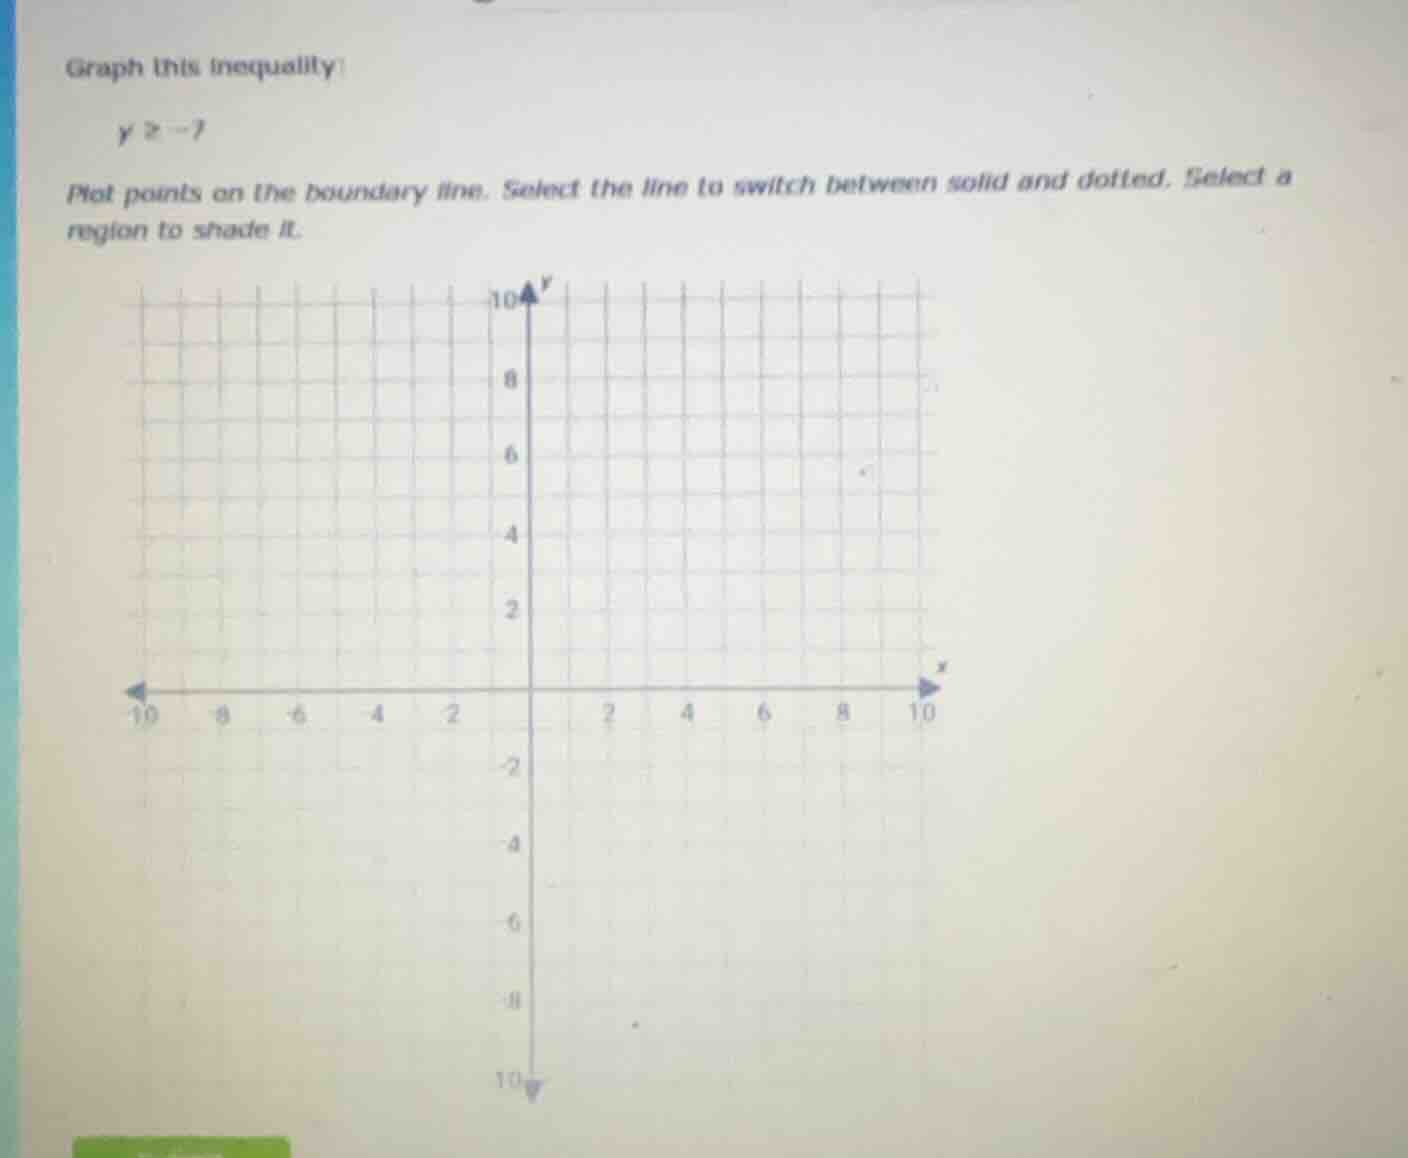
graph this inequality:
$y \geq -7$
plot points on the boundary line. select the line to switch between solid and dotted. select a region to shade it.
Step1: Identify the boundary line
The inequality is \( y \geq -7 \). The boundary line is \( y = -7 \), which is a horizontal line. Since the inequality is "greater than or equal to", the line should be solid (because the points on the line are included in the solution set).
Step2: Plot the boundary line
To plot \( y = -7 \), we can find points where \( y = -7 \) for any \( x \)-value. For example, when \( x = 0 \), \( y = -7 \) (the point \( (0, -7) \)); when \( x = 2 \), \( y = -7 \) (the point \( (2, -7) \)); when \( x = -3 \), \( y = -7 \) (the point \( (-3, -7) \)). Plot these points and draw a solid horizontal line through them.
Step3: Shade the region
The inequality \( y \geq -7 \) means we need to shade the region where \( y \) is greater than or equal to -7. This is the region above the line \( y = -7 \) (including the line itself). So we shade the area above the solid line \( y = -7 \).

Snap & solve any problem in the app
Get step-by-step solutions on Sovi AI
Photo-based solutions with guided steps
Explore more problems and detailed explanations
To graph \( y \geq -7 \):
- Draw a solid horizontal line at \( y = -7 \) (plot points like \( (0, -7) \), \( (2, -7) \), \( (-3, -7) \), etc., and connect them).
- Shade the region above this line (since \( y \) values greater than or equal to -7 are in the solution set).