QUESTION IMAGE
Question
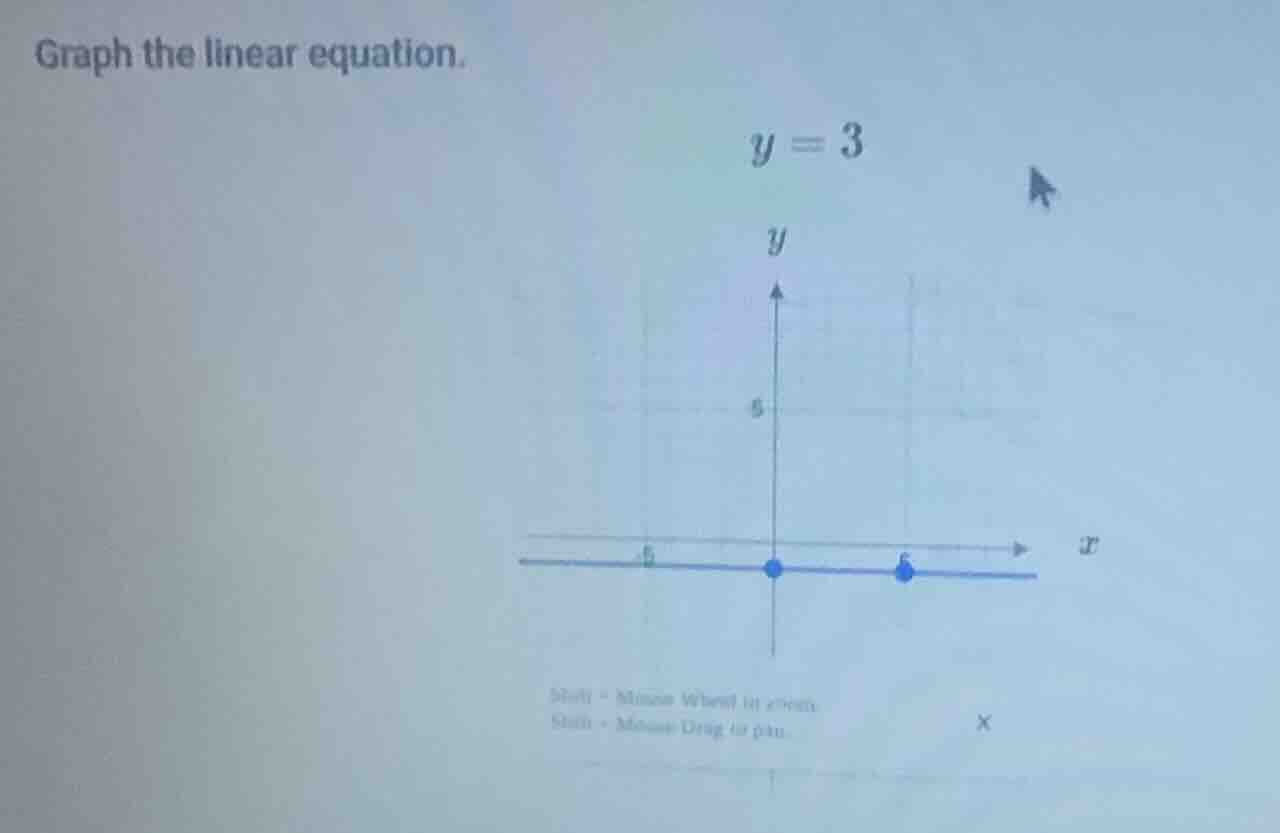
graph the linear equation. \\( y = 3 \\)
Step1: Analyze the equation \( y = 3 \)
The equation \( y = 3 \) represents a horizontal line. For any value of \( x \), the value of \( y \) is always 3. This means that all points on the line have a \( y \)-coordinate of 3.
Step2: Identify key points
We can choose two points to plot the line. For example, when \( x = 0 \), \( y = 3 \) (so the point is \( (0, 3) \)), and when \( x = 5 \), \( y = 3 \) (so the point is \( (5, 3) \)).
Step3: Draw the line
Plot the points \( (0, 3) \) and \( (5, 3) \) (or any other points with \( y = 3 \)) and draw a horizontal line through them. This line will be parallel to the \( x \)-axis and pass through all points where the \( y \)-coordinate is 3.

Snap & solve any problem in the app
Get step-by-step solutions on Sovi AI
Photo-based solutions with guided steps
Explore more problems and detailed explanations
To graph \( y = 3 \), draw a horizontal line parallel to the \( x \)-axis passing through all points with \( y \)-coordinate 3 (e.g., \( (0, 3) \), \( (5, 3) \), etc.).