QUESTION IMAGE
Question
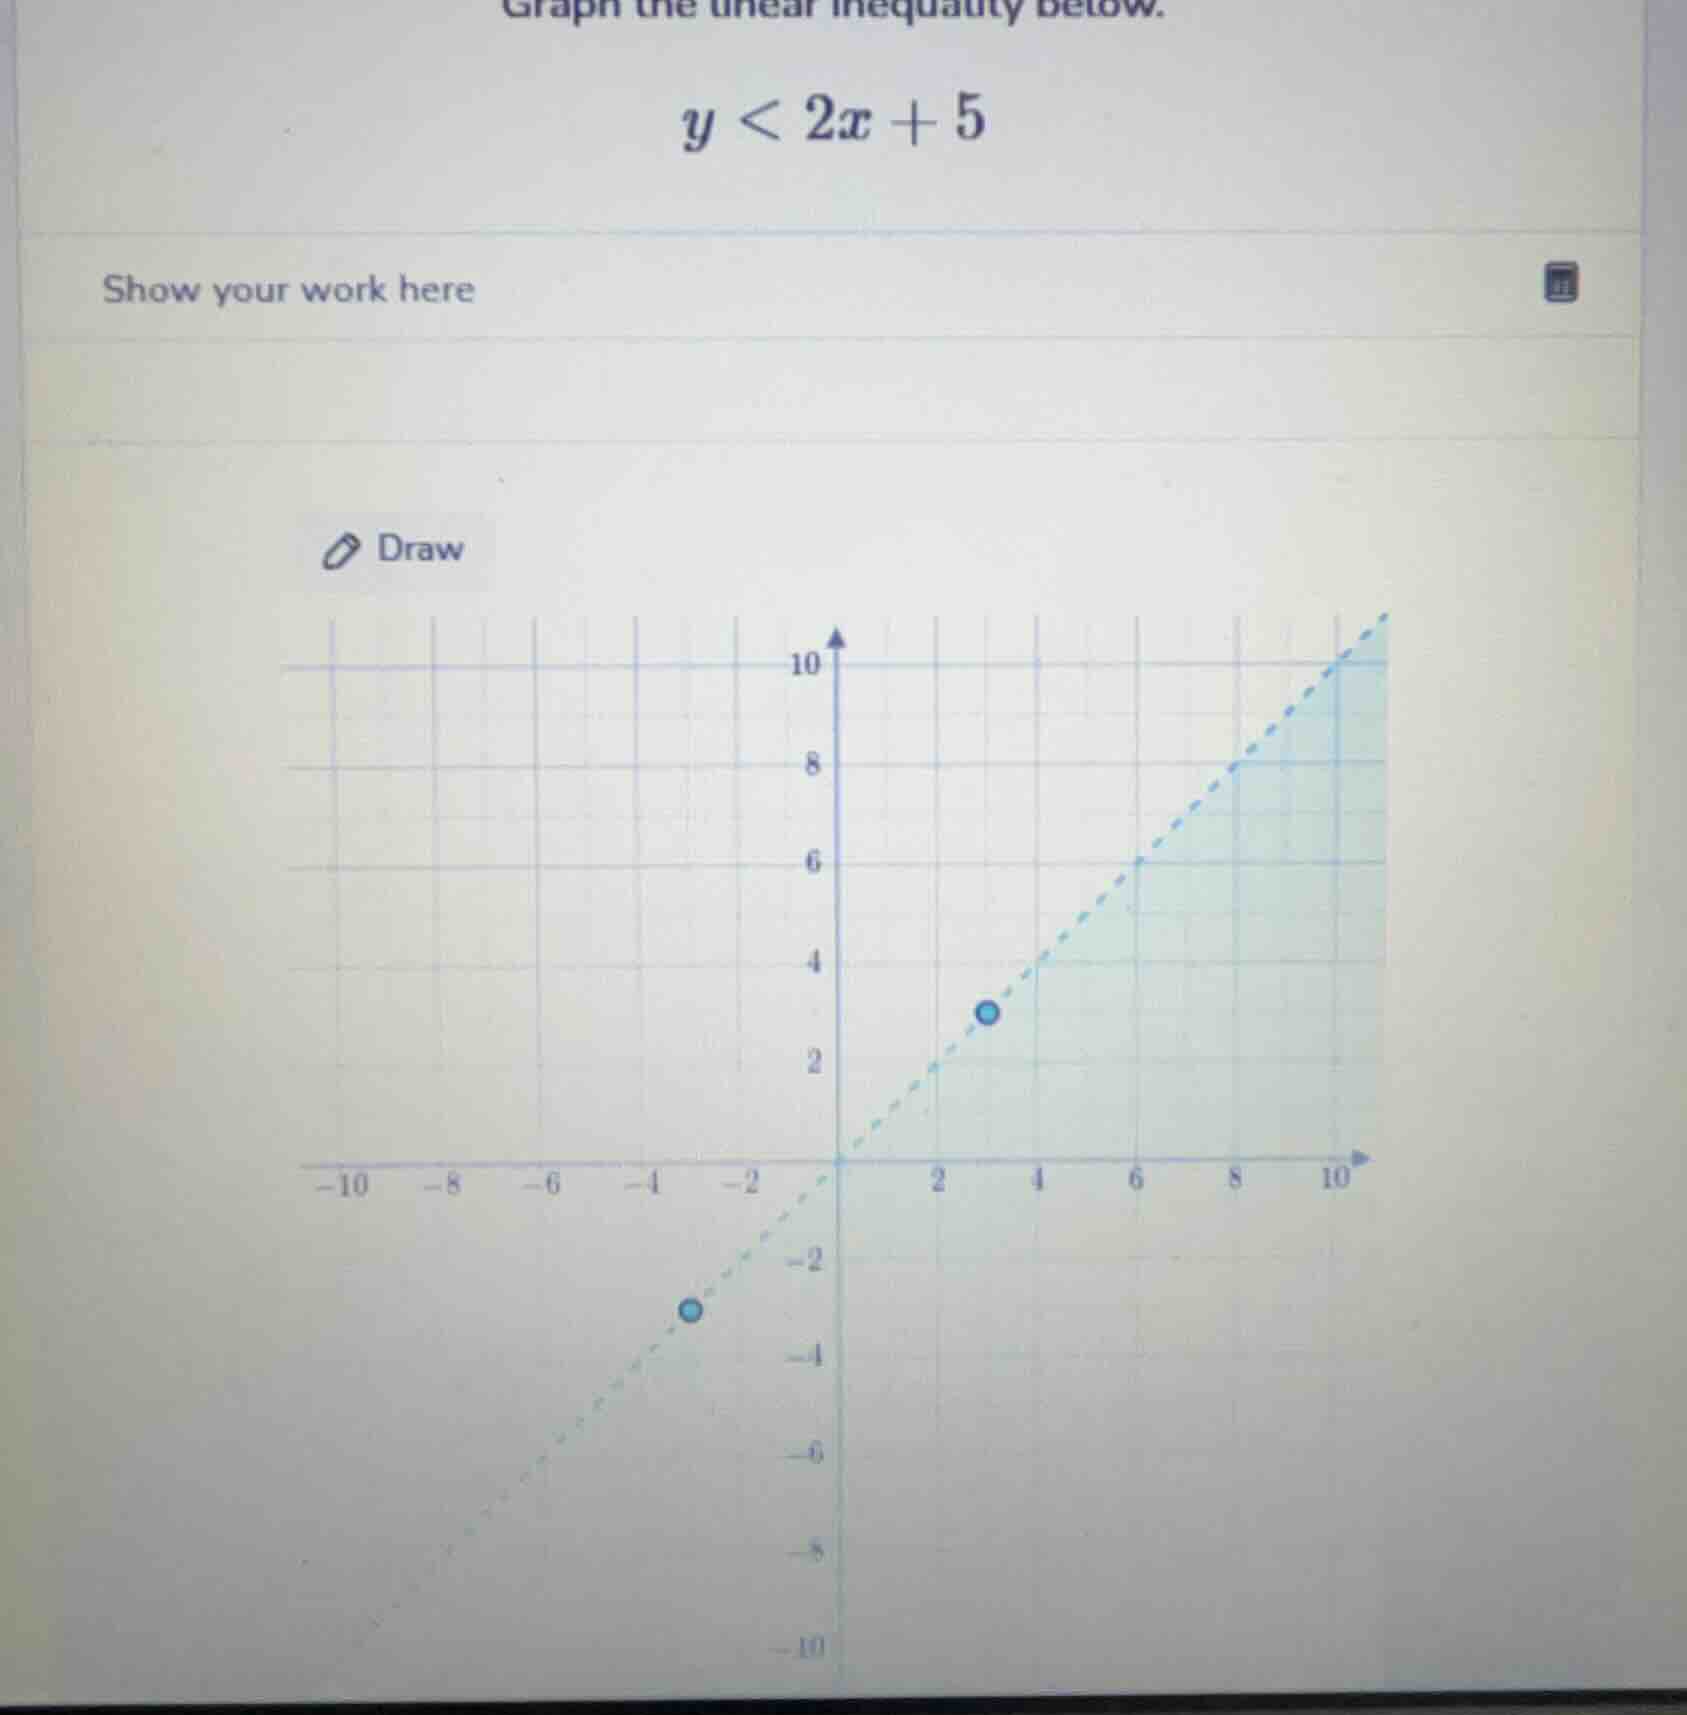
graph the linear inequality below.
$y < 2x + 5$
show your work here
Step1: Identify boundary line
The boundary is $y=2x+5$, slope $m=2$, y-intercept $b=5$.
Step2: Plot boundary line
Use dashed line (since $y<$, not $\leq$). Plot points: when $x=0$, $y=5$; $x=2$, $y=9$; $x=-3$, $y=-1$. Connect with dashed line.
Step3: Test a point for shading
Test $(0,0)$: $0 < 2(0)+5$ → $0<5$, which is true.
Step4: Shade correct region
Shade the area below the dashed line (since the test point in this region satisfies the inequality).

Snap & solve any problem in the app
Get step-by-step solutions on Sovi AI
Photo-based solutions with guided steps
Explore more problems and detailed explanations
The graph has a dashed line for $y=2x+5$, with the region below this line shaded.