QUESTION IMAGE
Question
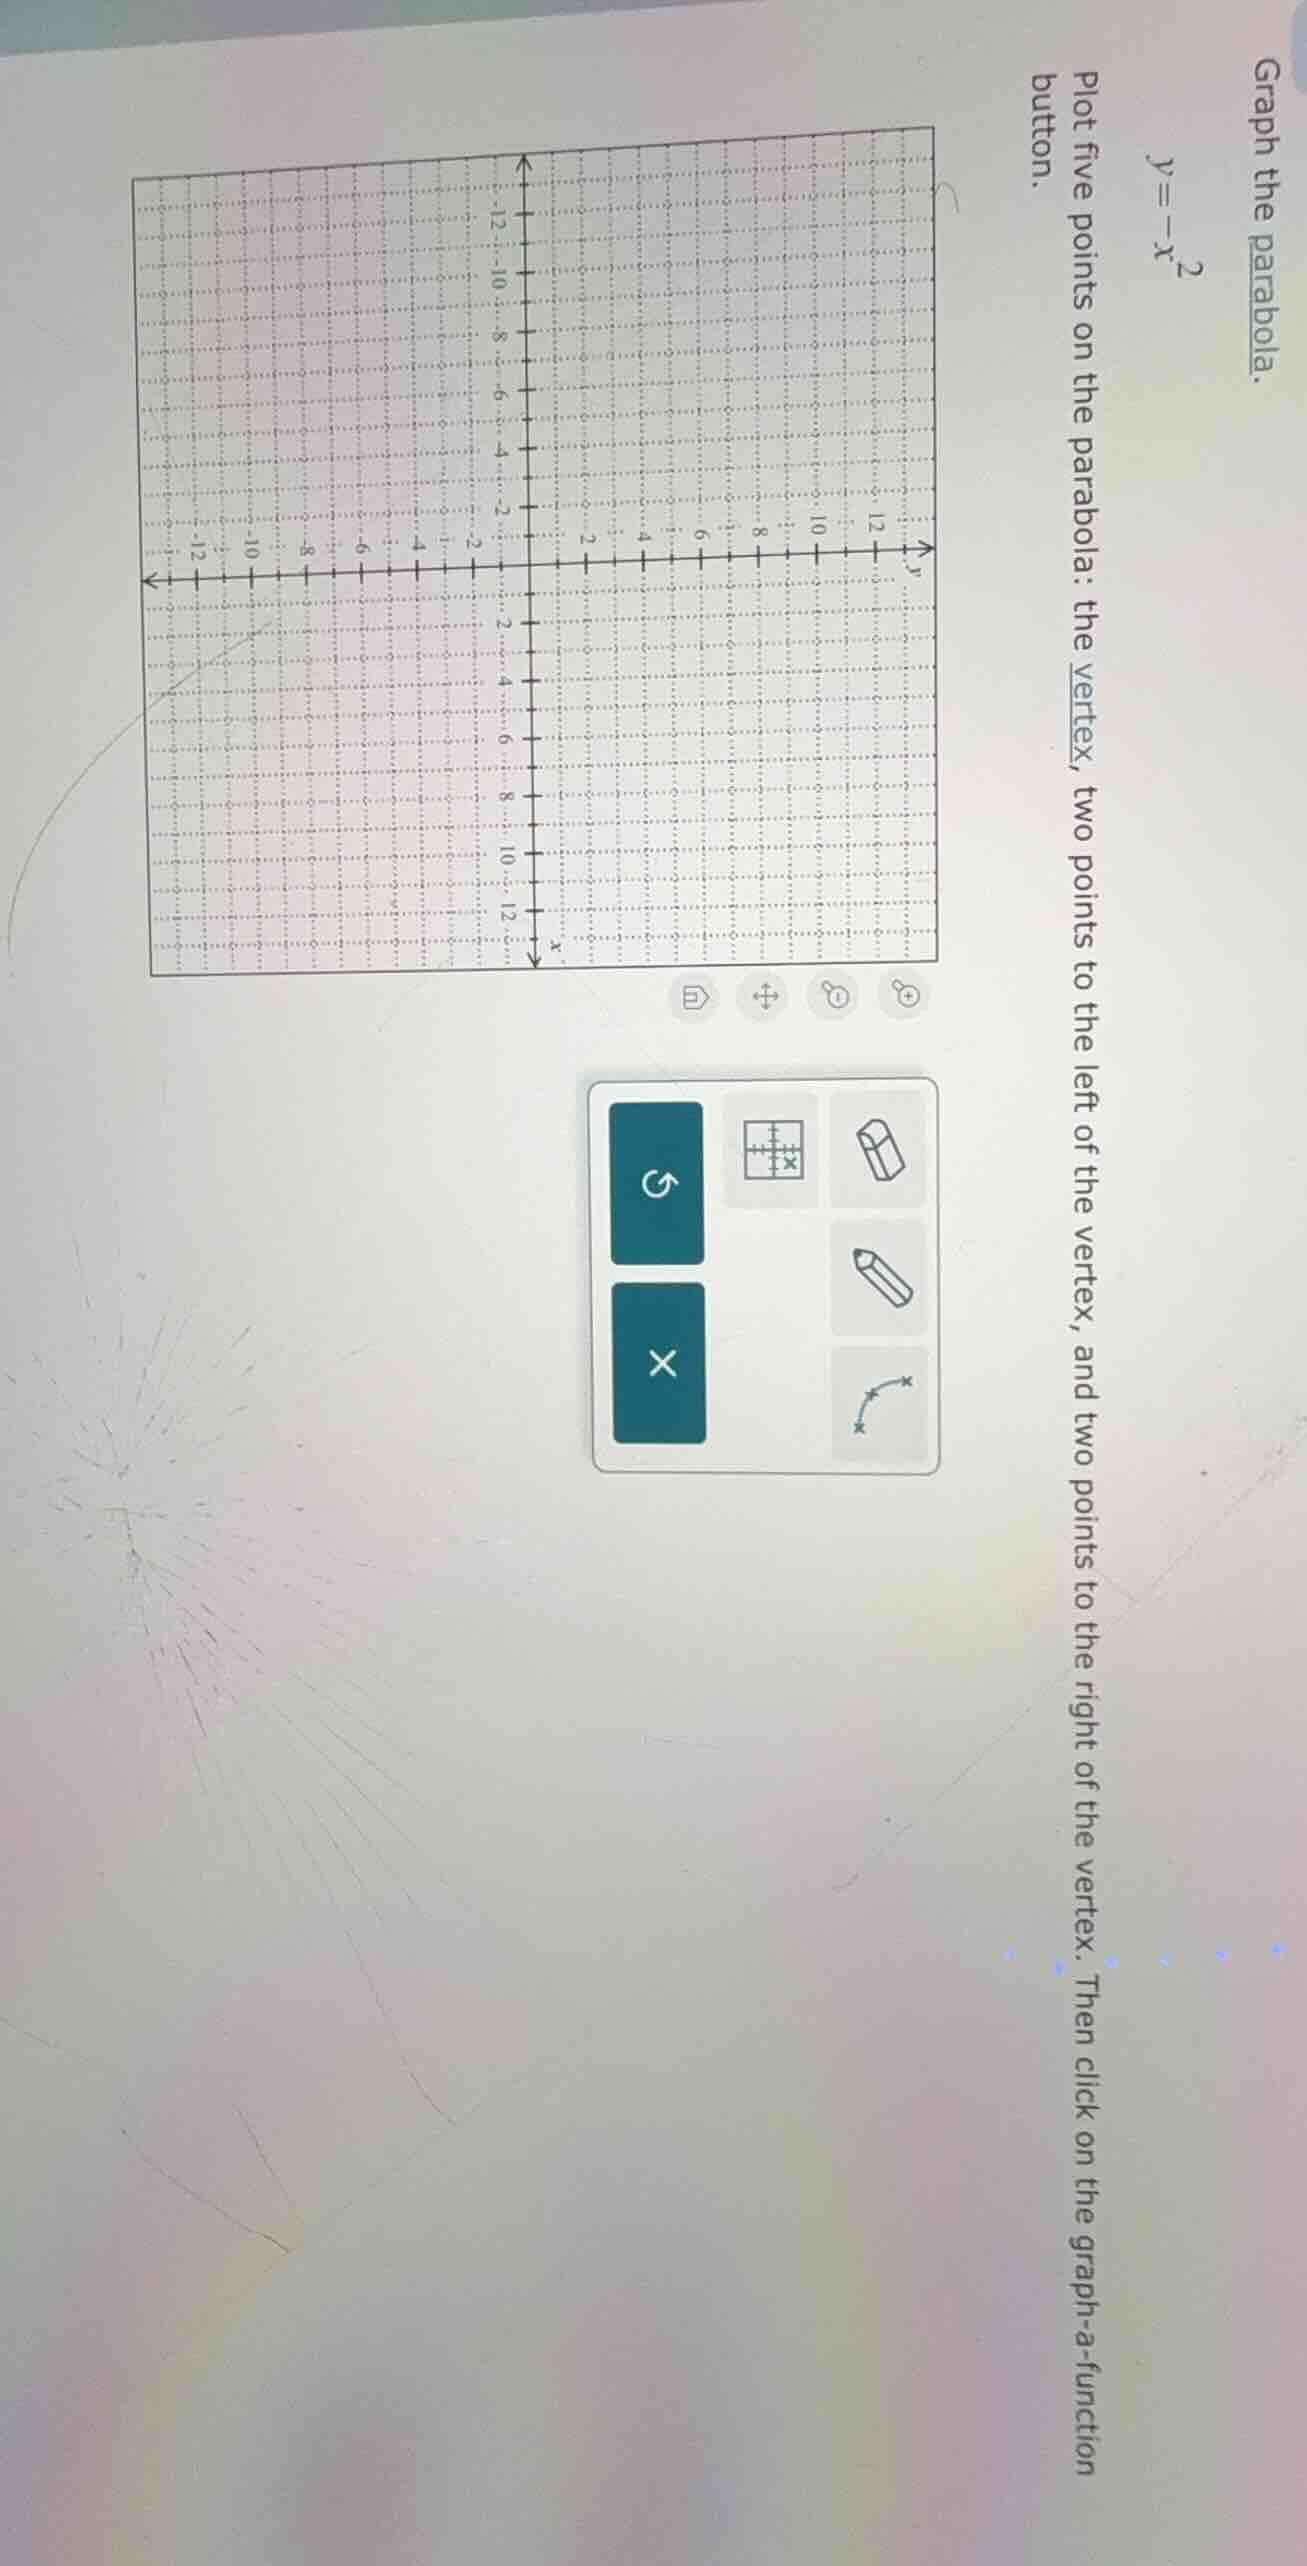
graph the parabola.
y = -x²
plot five points on the parabola: the vertex, two points to the left of the vertex, and two points to the right of the vertex. then click on the graph - a - function button.
Step1: Find the vertex
For the parabola \( y = -x^2 \), the vertex form of a parabola is \( y = a(x - h)^2 + k \), where \((h,k)\) is the vertex. Here, \( h = 0 \) and \( k = 0 \), so the vertex is \((0,0)\).
Step2: Find points to the left of the vertex
Let's choose \( x = -1 \) and \( x = -2 \).
- When \( x = -1 \), \( y = -(-1)^2 = -1 \), so the point is \((-1, -1)\).
- When \( x = -2 \), \( y = -(-2)^2 = -4 \), so the point is \((-2, -4)\).
Step3: Find points to the right of the vertex
Let's choose \( x = 1 \) and \( x = 2 \).
- When \( x = 1 \), \( y = -(1)^2 = -1 \), so the point is \((1, -1)\).
- When \( x = 2 \), \( y = -(2)^2 = -4 \), so the point is \((2, -4)\).

Snap & solve any problem in the app
Get step-by-step solutions on Sovi AI
Photo-based solutions with guided steps
Explore more problems and detailed explanations
The five points are the vertex \((0,0)\), two points to the left \((-1, -1)\), \((-2, -4)\) and two points to the right \((1, -1)\), \((2, -4)\). To graph the parabola, plot these points and draw a smooth curve through them.