QUESTION IMAGE
Question
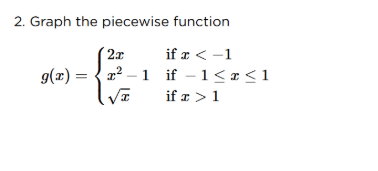
- graph the piecewise function
\\( g(x) = \
\\)
Step1: Analyze the first piece (\(2x\), \(x < -1\))
This is a linear function with slope \(2\). For \(x < -1\), we can find a few points. When \(x=-2\), \(y = 2\times(-2)=-4\). The line is defined for all \(x < -1\), and it has an open circle at \(x = -1\) (since the inequality is strict, \(x < -1\)). To find the value at \(x=-1\) for this piece, we substitute \(x=-1\) into \(2x\), getting \(y = 2\times(-1)=-2\), but we mark an open circle at \((-1, -2)\) for this piece.
Step2: Analyze the second piece (\(x^{2}-1\), \(-1\leq x\leq1\))
This is a quadratic function. Let's find some key points. When \(x = -1\), \(y=(-1)^{2}-1=1 - 1 = 0\) (closed circle here, since the inequality includes \(x=-1\)). When \(x = 0\), \(y=0^{2}-1=-1\). When \(x = 1\), \(y=1^{2}-1=0\) (closed circle here, since the inequality includes \(x = 1\)). The vertex of the parabola \(y=x^{2}-1\) is at \((0, -1)\) (since the standard form of a parabola \(y = ax^{2}+bx + c\) has vertex at \(x=-\frac{b}{2a}\), here \(a = 1\), \(b = 0\), so \(x = 0\)).
Step3: Analyze the third piece (\(\sqrt{x}\), \(x>1\))
This is a square - root function. For \(x>1\), when \(x = 2\), \(y=\sqrt{2}\approx1.414\); when \(x = 4\), \(y = 2\). The function is defined for \(x>1\), so we have an open circle at \(x = 1\) for this piece. Substituting \(x = 1\) into \(\sqrt{x}\), we get \(y=\sqrt{1}=1\), so we mark an open circle at \((1, 1)\) for this piece.
Step4: Plot the points and draw the graphs
- For the first piece (\(y = 2x\), \(x < -1\)): Draw a straight line with slope \(2\), passing through points like \((-2,-4)\), with an open circle at \((-1, -2)\).
- For the second piece (\(y=x^{2}-1\), \(-1\leq x\leq1\)): Draw a parabola opening upwards with vertex at \((0, -1)\), passing through \((-1,0)\) and \((1,0)\) (closed circles at these points).
- For the third piece (\(y=\sqrt{x}\), \(x > 1\)): Draw the square - root curve starting from an open circle at \((1,1)\) and increasing as \(x\) increases, passing through points like \((2,\sqrt{2})\), \((4,2)\) etc.

Snap & solve any problem in the app
Get step-by-step solutions on Sovi AI
Photo-based solutions with guided steps
Explore more problems and detailed explanations
The graph of \(g(x)\) consists of:
- A line segment (with an open circle at \(x=-1\)) for \(y = 2x\) when \(x < -1\).
- A parabola segment (with closed circles at \(x=-1\) and \(x = 1\)) for \(y=x^{2}-1\) when \(-1\leq x\leq1\).
- A square - root curve segment (with an open circle at \(x = 1\)) for \(y=\sqrt{x}\) when \(x>1\).
(To get a more precise graph, you can use graphing software or plot more points for each piece. For example, for \(y = 2x\) with \(x < -1\), you can take \(x=-3\), \(y=-6\); for \(y=x^{2}-1\) with \(-1\leq x\leq1\), you can take \(x = 0.5\), \(y=(0.5)^{2}-1=-0.75\); for \(y=\sqrt{x}\) with \(x>1\), you can take \(x = 3\), \(y=\sqrt{3}\approx1.732\))