QUESTION IMAGE
Question
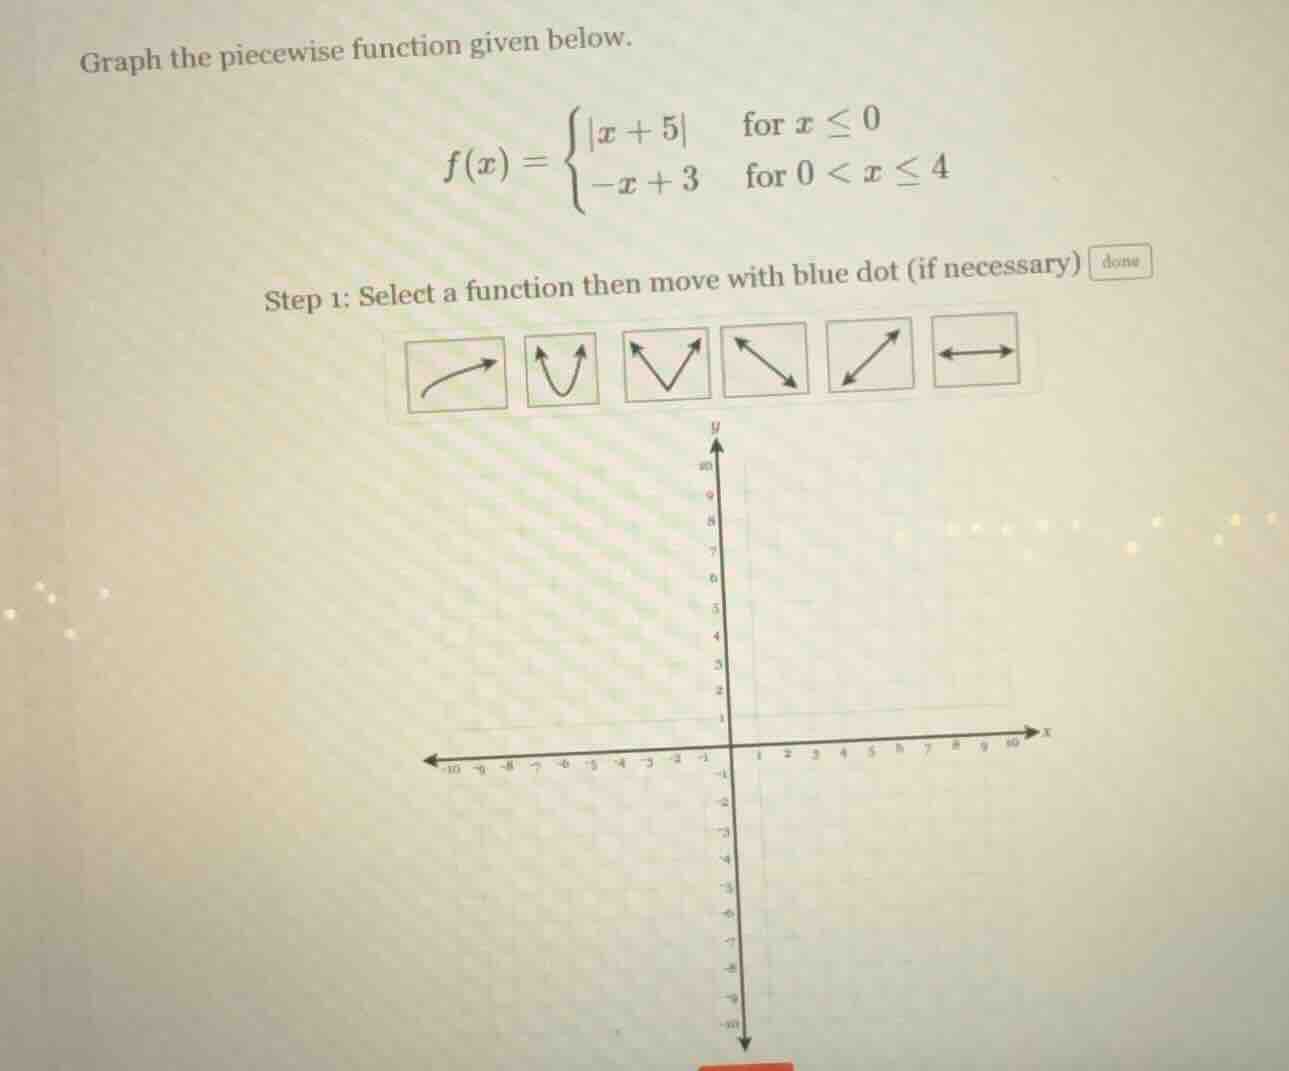
graph the piecewise function given below.
$f(x)=\
$
step 1: select a function then move with blue dot (if necessary)
Step1: Analyze \( f(x) = |x + 5| \) for \( x \leq 0 \)
The absolute - value function \( y = |x + 5| \) can be written as a piecewise function: \( y=
\). The vertex of \( y=|x + 5| \) is at \( x=-5,y = 0 \) (when \( x=-5,| - 5 + 5|=0 \)). For \( x\leq0 \), we consider the part of the absolute - value graph. When \( x = 0 \), \( f(0)=|0 + 5|=5 \). The graph of \( y = |x+5| \) is a V - shaped graph (the third icon from the left, which is a V - shaped graph) with vertex at \( (-5,0) \) and passing through \( (0,5) \) for the domain \( x\leq0 \).
Step2: Analyze \( f(x)=-x + 3 \) for \( 0 < x\leq4 \)
The function \( y=-x + 3 \) is a linear function with a slope of \( m=-1 \) and a y - intercept of \( b = 3 \). When \( x = 0 \), \( y=3 \) (but since \( x>0 \) in this part, we have an open circle at \( (0,3) \)). When \( x = 4 \), \( y=-4 + 3=-1 \), so we have a closed circle at \( (4,-1) \). The graph of a linear function with a negative slope is a straight line with a downward - going trend (the fourth icon from the left, a line with a negative slope) for the domain \( 0 < x\leq4 \).
Step3: Graphing the first part (\( y = |x + 5|,x\leq0 \))
Plot the vertex at \( (-5,0) \). Then, for \( x\geq - 5 \) (within \( x\leq0 \)), when \( x=-4 \), \( y=|-4 + 5| = 1 \); when \( x=-3 \), \( y=|-3 + 5| = 2 \); and so on until \( x = 0 \) where \( y = 5 \). Connect these points with the V - shaped graph (the third icon) for \( x\leq0 \).
Step4: Graphing the second part (\( y=-x + 3,0 < x\leq4 \))
Start with an open circle at \( (0,3) \) (since \( x>0 \) here). Then, use the linear graph (the fourth icon) with slope - 1. When \( x = 1 \), \( y=-1 + 3 = 2 \); when \( x = 2 \), \( y=-2+3 = 1 \); when \( x = 3 \), \( y=-3 + 3=0 \); when \( x = 4 \), \( y=-4 + 3=-1 \). Plot these points and draw the line segment from \( (0,3) \) (open circle) to \( (4,-1) \) (closed circle).
(Note: Since the problem is about graphing, the final answer is the graph constructed by following the above steps. The key is to identify the correct graph shapes for each piece of the piecewise function. The first piece \( |x + 5| \) for \( x\leq0 \) uses the V - shaped absolute - value graph, and the second piece \( -x + 3 \) for \( 0 < x\leq4 \) uses the linear graph with negative slope.)

Snap & solve any problem in the app
Get step-by-step solutions on Sovi AI
Photo-based solutions with guided steps
Explore more problems and detailed explanations
The graph consists of two parts: 1. A V - shaped graph (for \( y = |x + 5|,x\leq0 \)) with vertex at \((-5,0)\) and passing through \((0,5)\). 2. A line segment (for \( y=-x + 3,0 < x\leq4 \)) with an open circle at \((0,3)\) and a closed circle at \((4,-1)\) and a slope of \(-1\). (To graph, use the V - shaped icon for the absolute - value part and the linear - with - negative - slope icon for the linear part and plot the key points as described.)