QUESTION IMAGE
Question
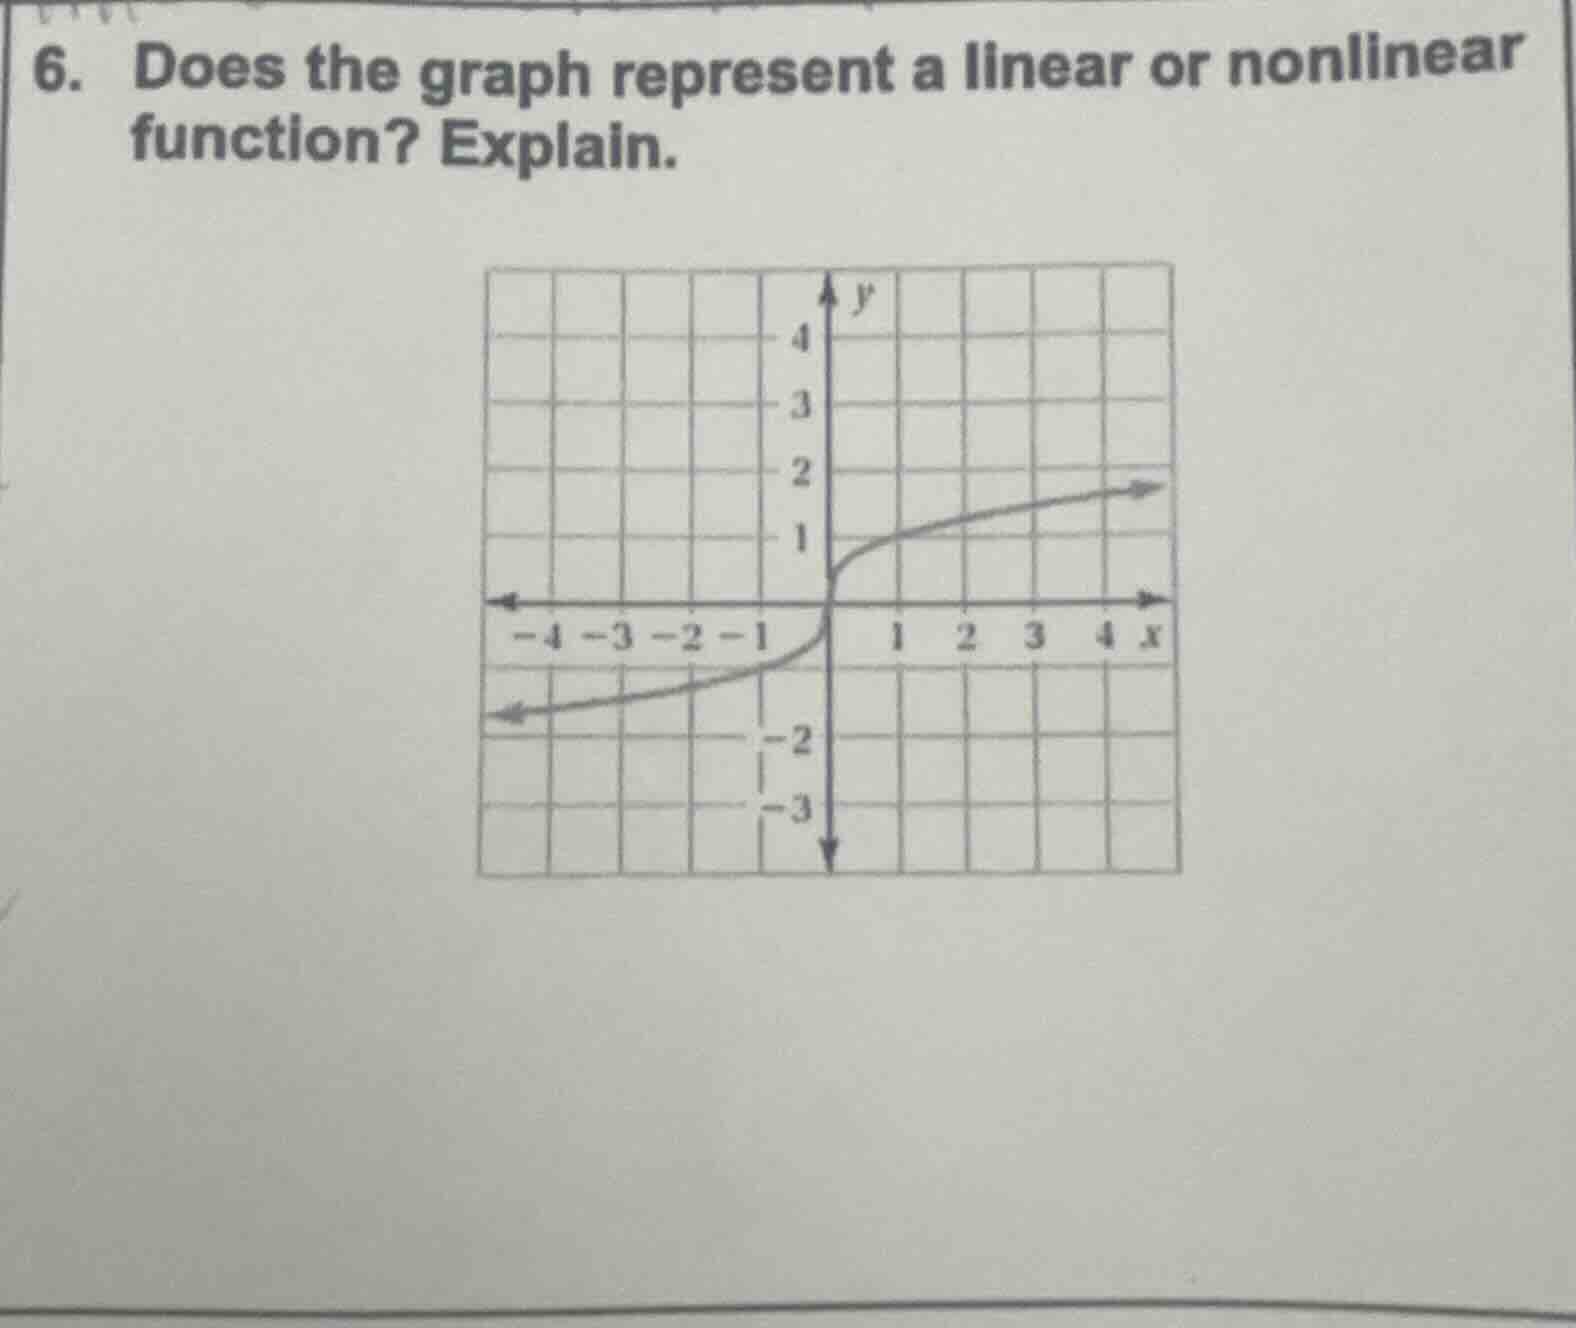
- does the graph represent a linear or nonlinear function? explain.
Brief Explanations
A linear function graphs as a straight line, with a constant rate of change (slope). The given graph is a curved line, meaning its rate of change is not constant.

Snap & solve any problem in the app
Get step-by-step solutions on Sovi AI
Photo-based solutions with guided steps
Explore more problems and detailed explanations
The graph represents a nonlinear function. It is a curved line, not a straight line, so it does not have a constant rate of change required for a linear function.