QUESTION IMAGE
Question
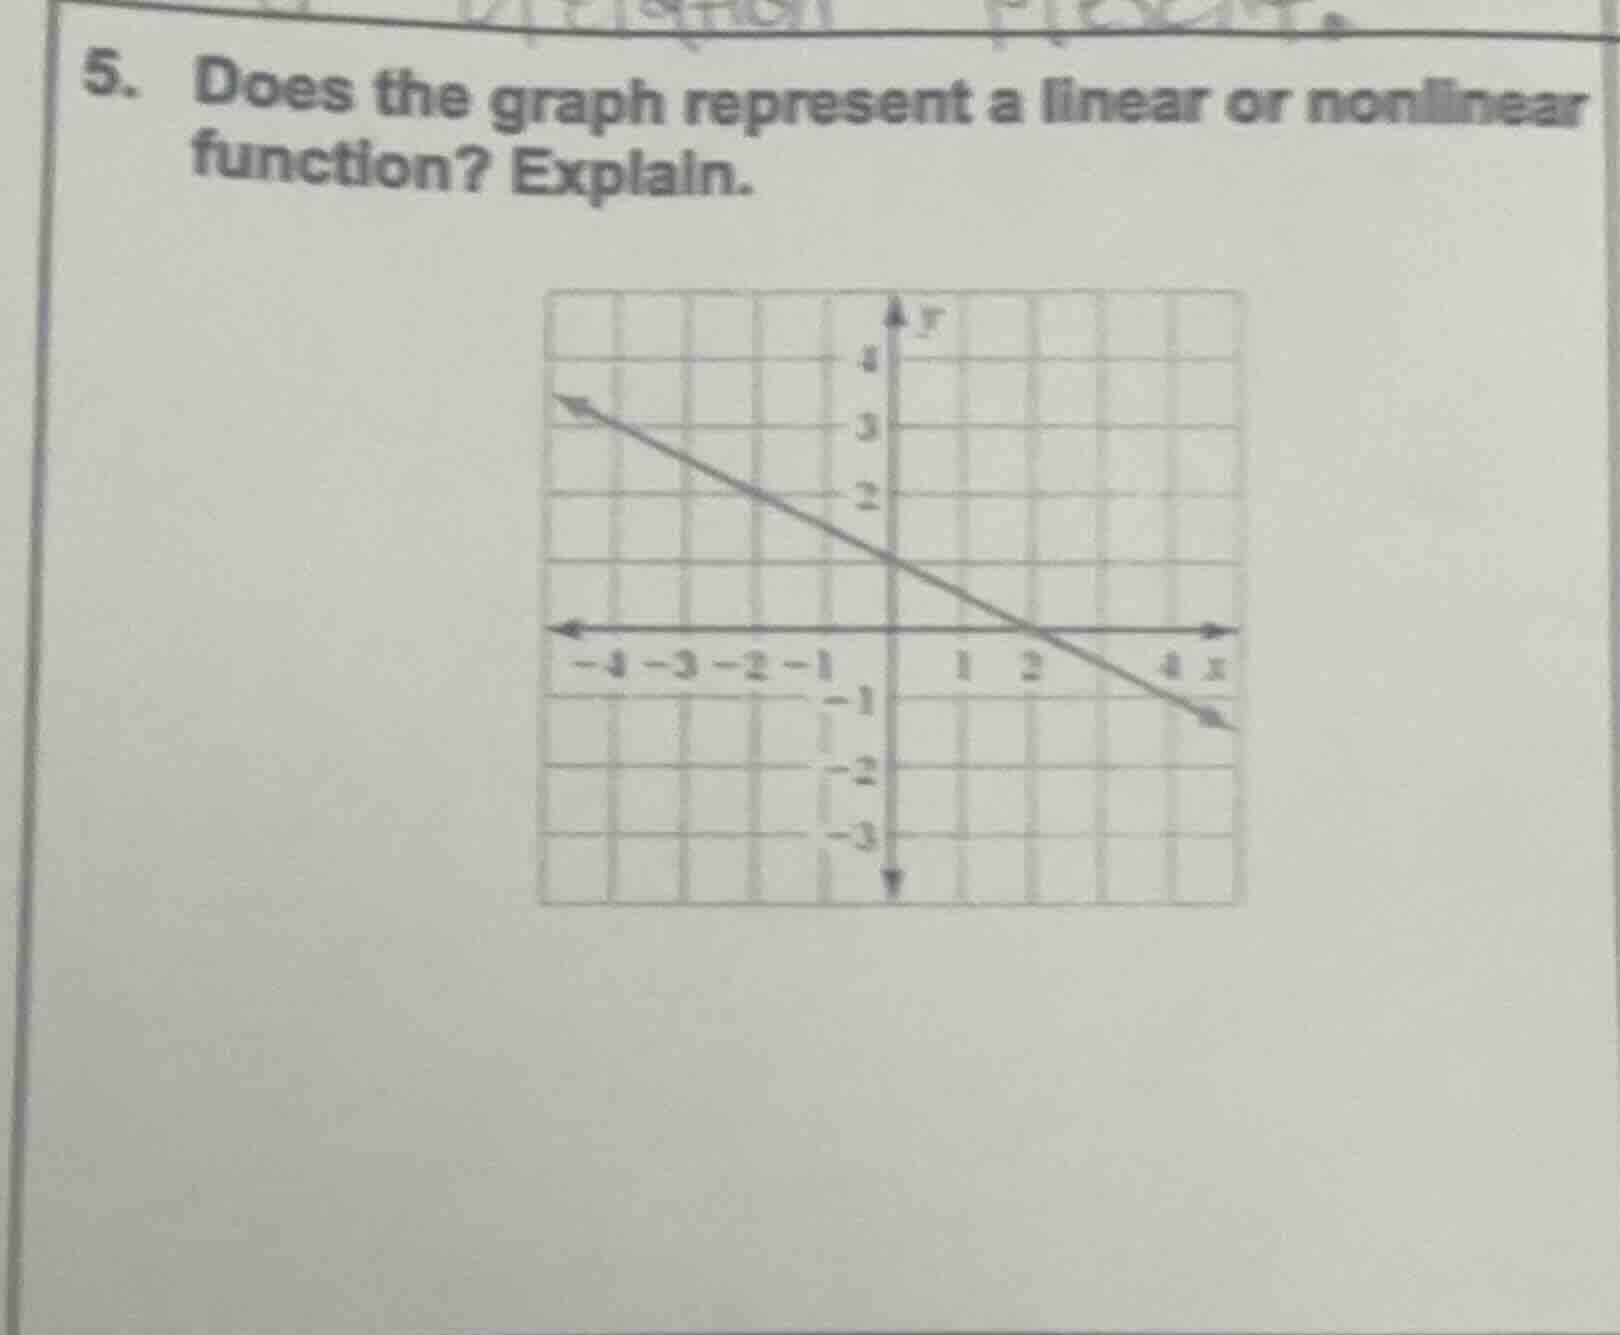
- does the graph represent a linear or nonlinear function? explain.
Brief Explanations
A linear function graphs as a straight line, has a constant rate of change (slope), and follows the form $y=mx+b$ where $m$ and $b$ are constants. The given graph is a straight line, with a consistent slope across all points, fitting the definition of a linear function.

Snap & solve any problem in the app
Get step-by-step solutions on Sovi AI
Photo-based solutions with guided steps
Explore more problems and detailed explanations
The graph represents a linear function, because it is a straight line with a constant rate of change (slope), which is a defining characteristic of linear functions.