QUESTION IMAGE
Question
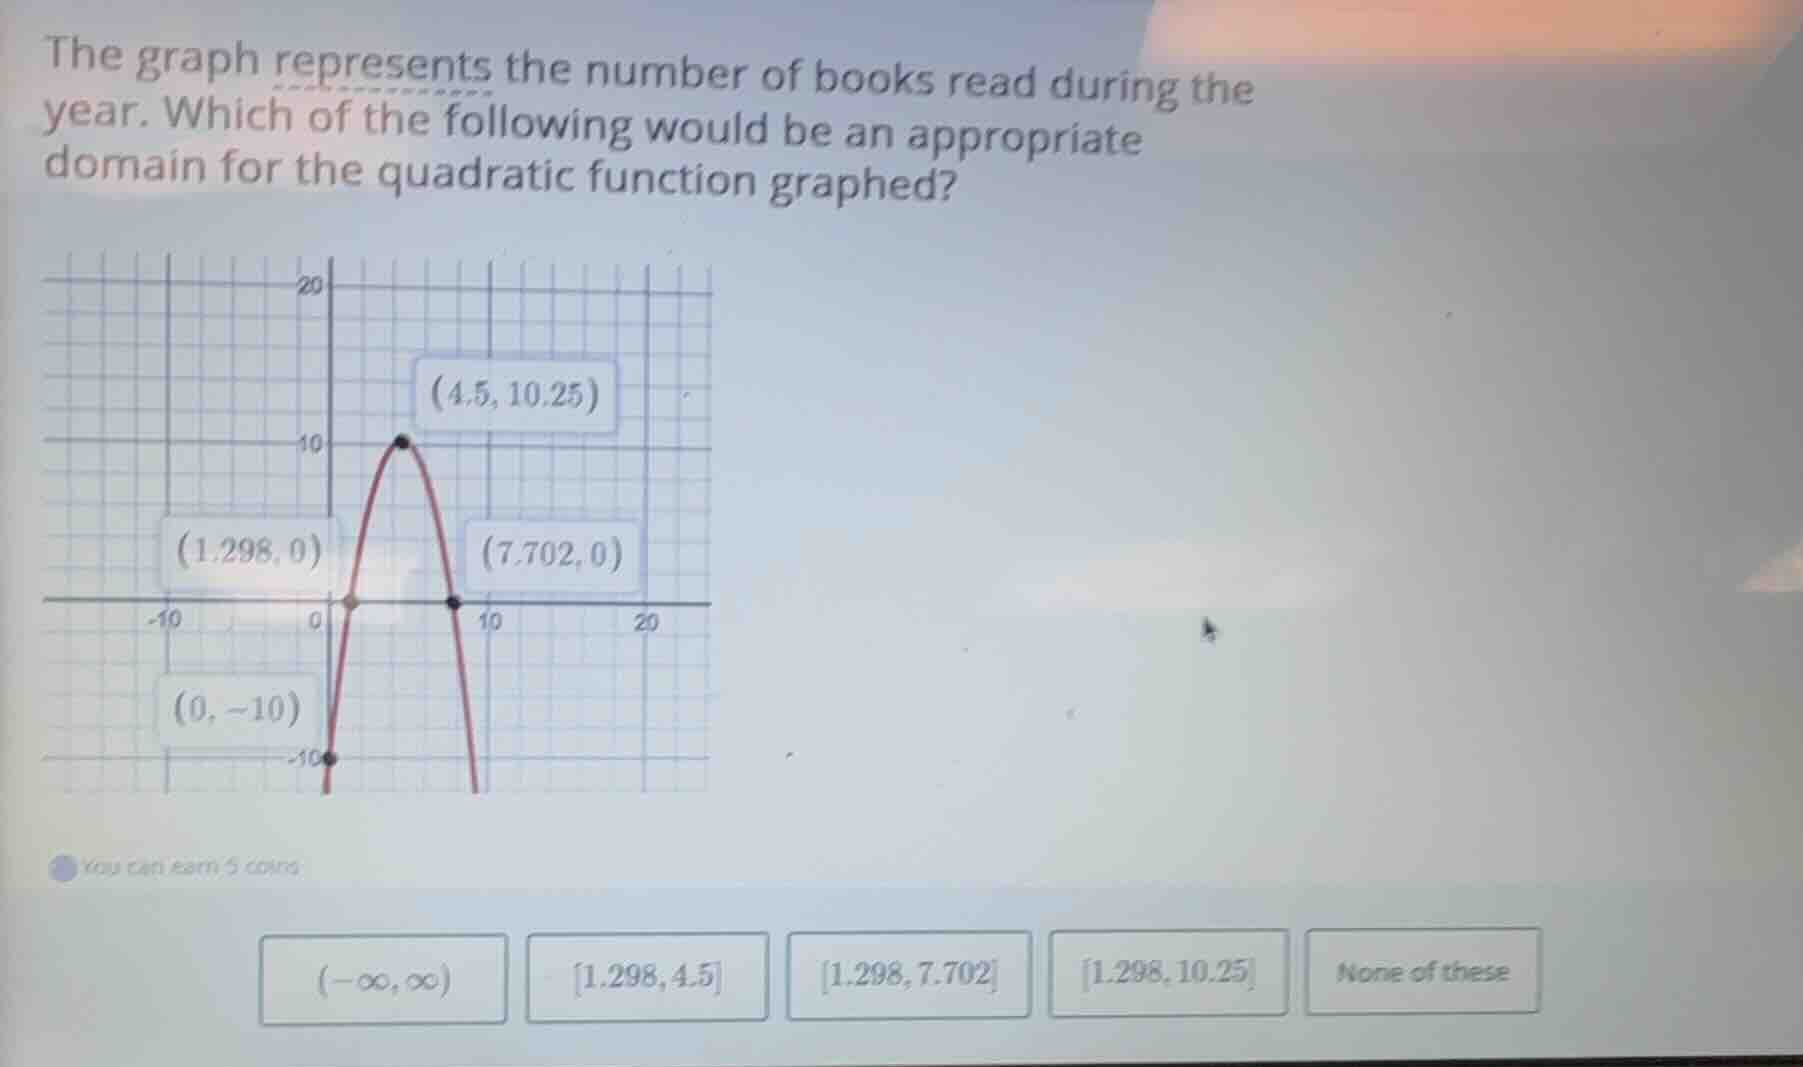
the graph represents the number of books read during the year. which of the following would be an appropriate domain for the quadratic function graphed? (1.298, 0) (4.5, 10.25) (7.702, 0) (0, -10) (-∞, ∞) 1.298, 4.5 1.298, 7.702 1.298, 10.25 none of these
Step1: Understand domain context
The domain represents the number of books read, which cannot be negative, and the graph models a real-world scenario where the number of books (x-values) must result in a non-negative number of books read (since you can't read a negative number of books, we only consider where the function is non-negative, i.e., above or on the x-axis).
Step2: Identify valid x-values
The quadratic function crosses the x-axis at $x=1.298$ and $x=7.702$, and is non-negative between these two points. Outside this interval, the function is negative, which doesn't make sense for counting books read.
Step3: Match to options
The interval $[1.298, 7.702]$ includes all valid x-values where the number of books read is non-negative, fitting the real-world context.

Snap & solve any problem in the app
Get step-by-step solutions on Sovi AI
Photo-based solutions with guided steps
Explore more problems and detailed explanations
[1.298, 7.702]