QUESTION IMAGE
Question
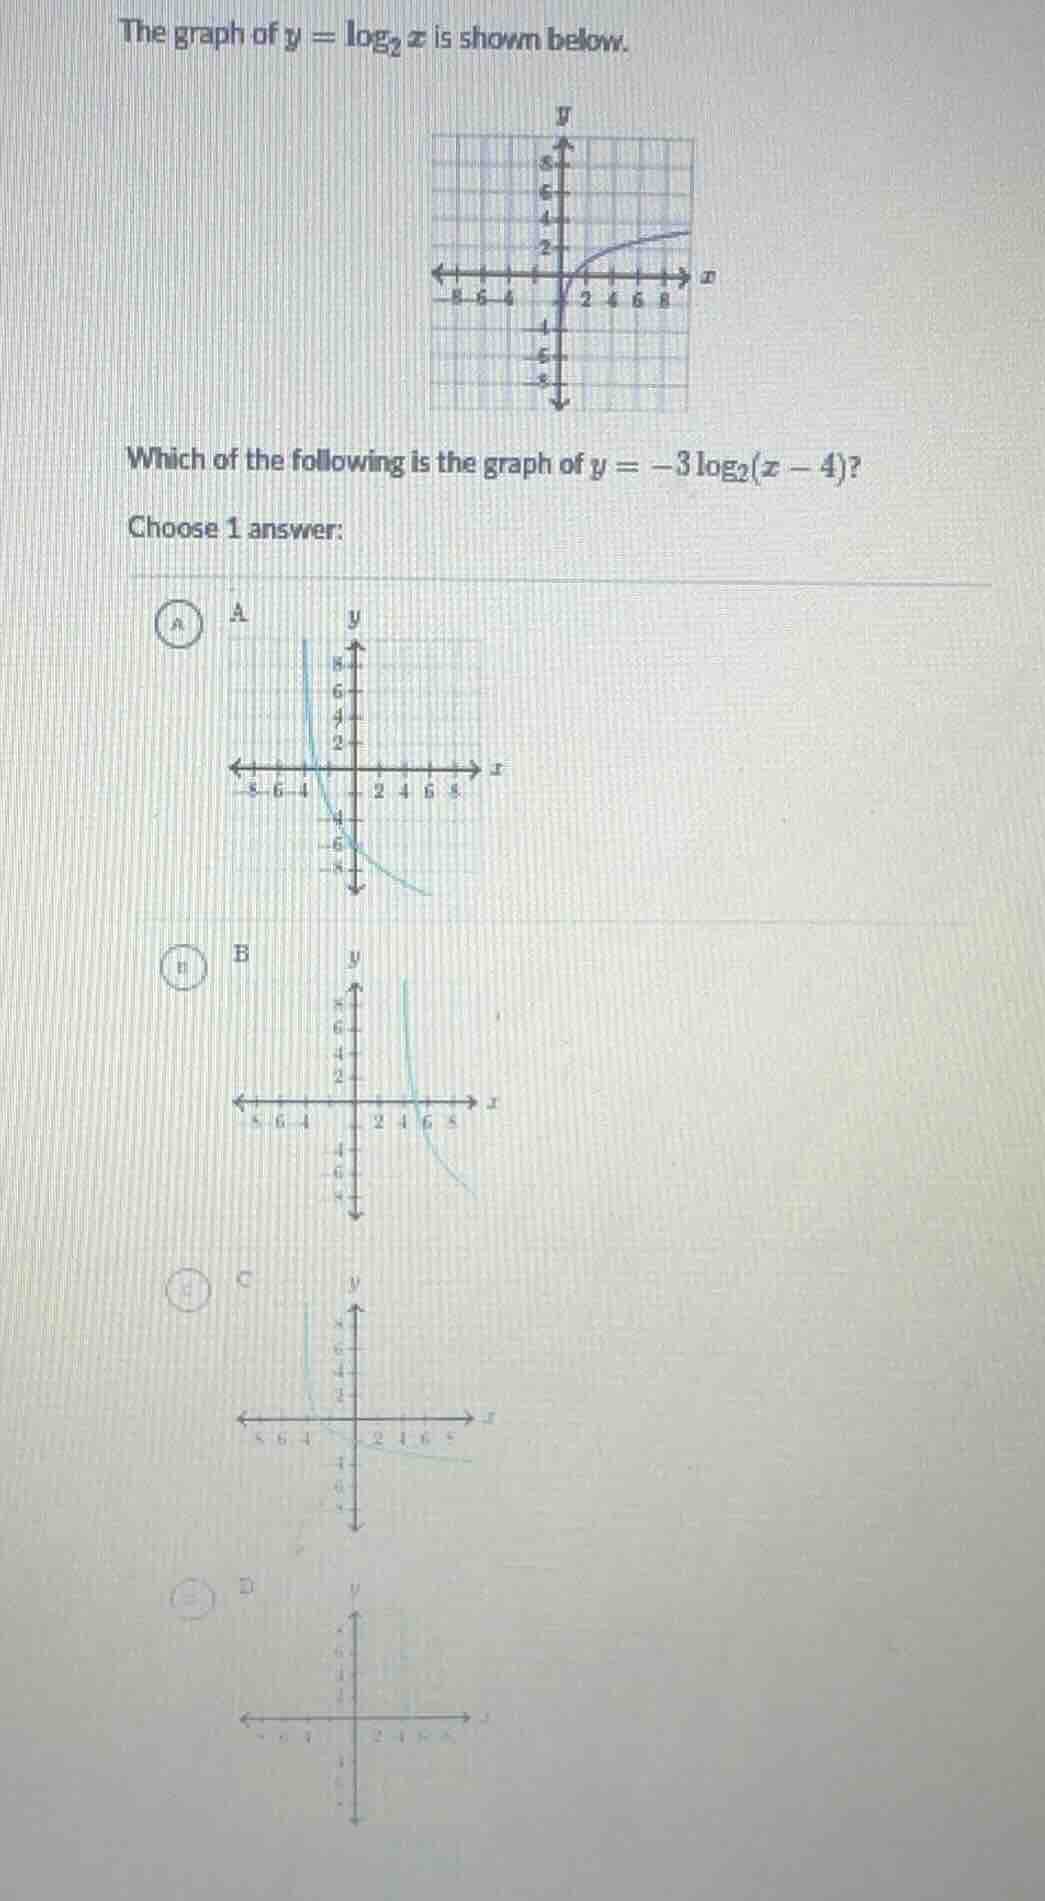
the graph of $y = \log_{2} x$ is shown below.
which of the following is the graph of $y = -3\log_{2}(x - 4)$?
choose 1 answer:
a image of graph a
b image of graph b
c image of graph c
d image of graph d
Step1: Identify horizontal shift
For $y=\log_2(x-4)$, shift $y=\log_2 x$ right 4 units. Vertical asymptote becomes $x=4$.
Step2: Identify vertical stretch/reflection
Multiply by $-3$: reflect over x-axis, stretch vertically by 3. The graph will decrease as $x$ increases, and pass through $(5, 0)$ (since $\log_2(5-4)=\log_2 1=0$, so $-3*0=0$) and $(6, -3)$ (since $\log_2(6-4)=\log_2 2=1$, so $-3*1=-3$).

Snap & solve any problem in the app
Get step-by-step solutions on Sovi AI
Photo-based solutions with guided steps
Explore more problems and detailed explanations
B. <The graph with vertical asymptote $x=4$, decreasing as $x$ increases, passing through positive x-values right of 4>