QUESTION IMAGE
Question
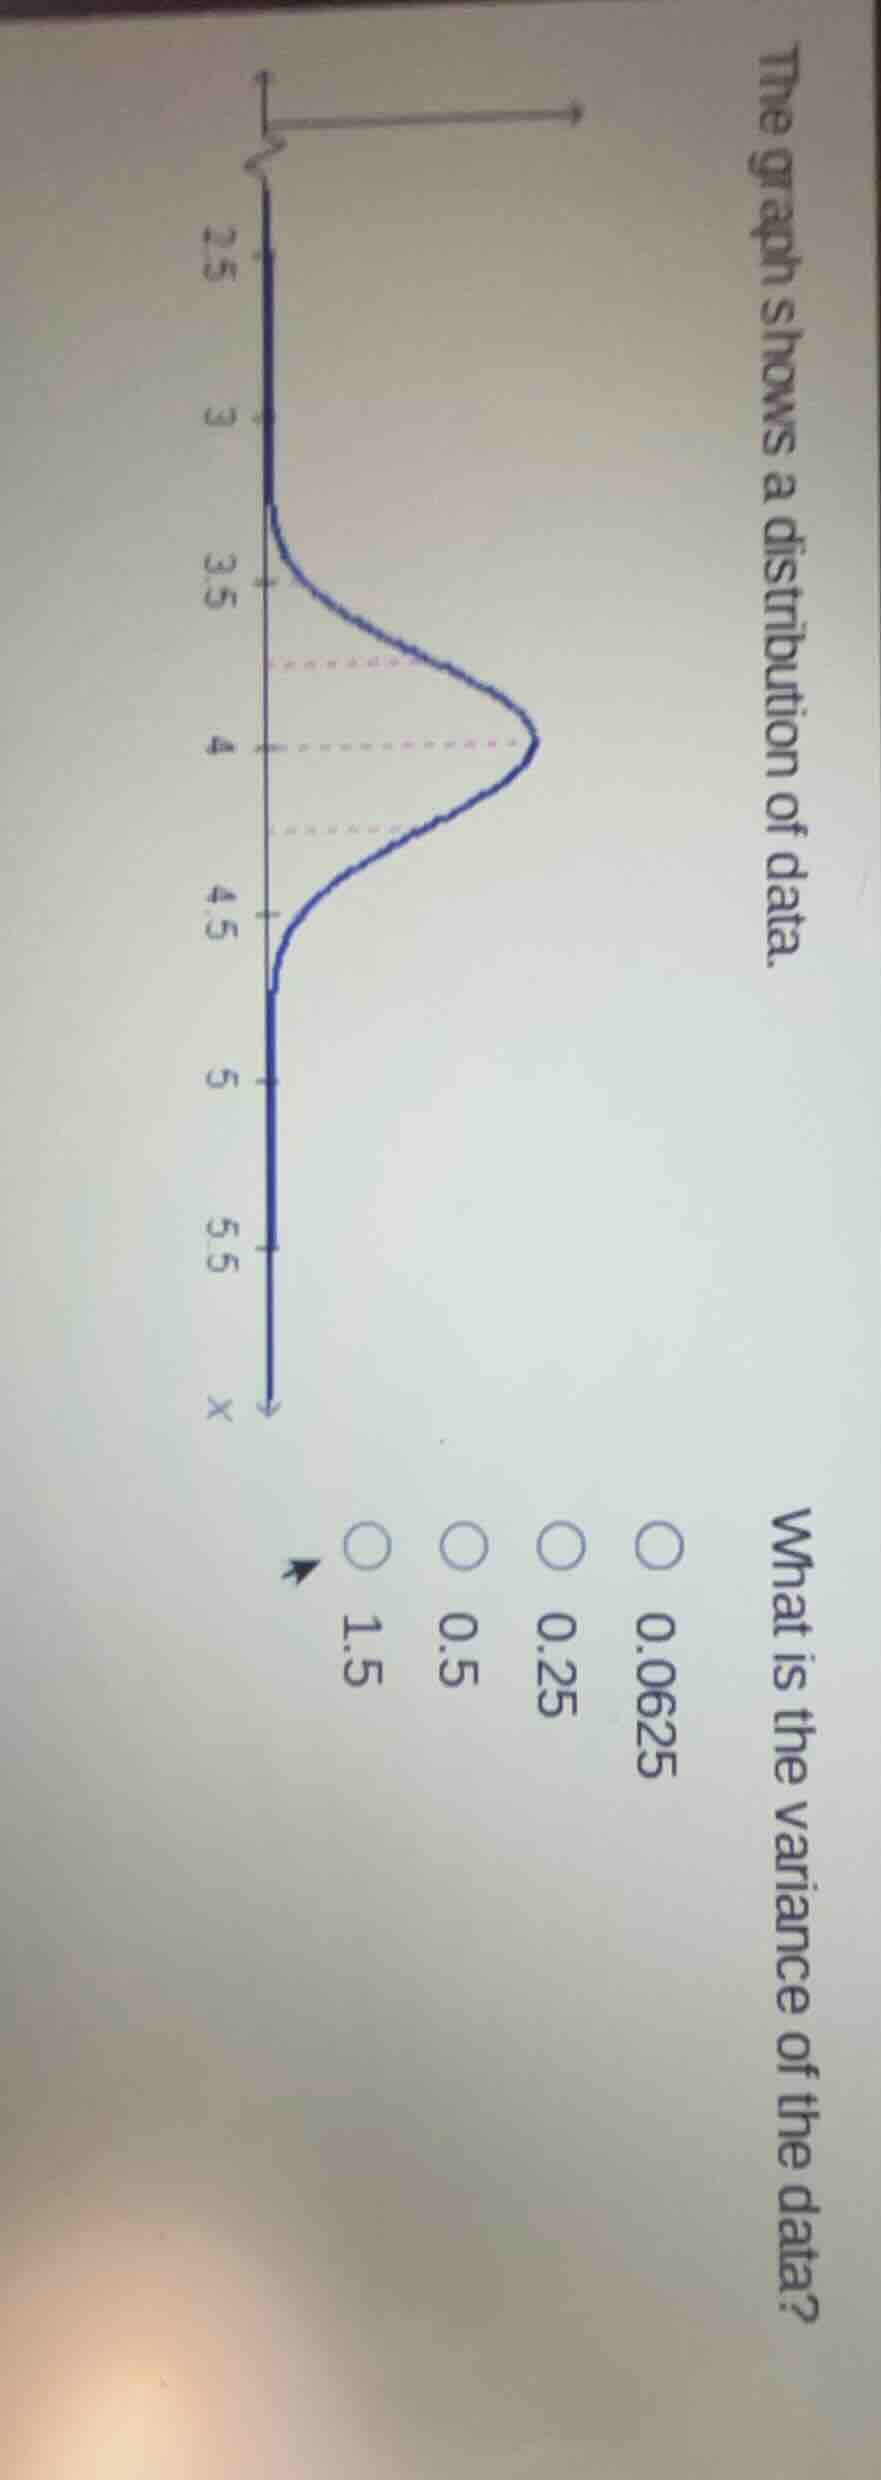
the graph shows a distribution of data. what is the variance of the data? options: 0.0625, 0.25, 0.5, 1.5
Step1: Identify the distribution type
The graph appears to be a normal - like distribution (or a symmetric distribution). From the x - axis, we can see that the data is centered around a mean. Let's assume this is a uniform or a symmetric distribution with a certain range. Wait, actually, looking at the x - axis values, the data seems to be in the range where we can calculate the variance. Wait, maybe this is a distribution where we can use the formula for variance. Wait, another approach: maybe this is a distribution related to a discrete or continuous variable. Wait, looking at the options, the variance values are 0.0625, 0.25, 0.5, 1.5. Let's think about the range of the data. The x - axis has values from around 2.5 to 5.5, but the main distribution is between 3 and 4.5? Wait, no, the graph shows that the data is symmetric around a mean. Let's assume that this is a distribution where we can calculate the variance. Wait, maybe it's a distribution with a standard deviation that we can find. Wait, the variance is the square of the standard deviation. Let's check the options. If the variance is 0.0625, the standard deviation is 0.25. If variance is 0.25, standard deviation is 0.5. Let's think about the spread of the data. The graph shows that the data is relatively tightly clustered. Wait, maybe this is a distribution where we can calculate the variance as follows: Let's assume that the data is symmetric and we can find the mean and then the squared differences. But maybe there's a simpler way. Wait, the options include 0.0625, which is (0.25)^2, 0.25 which is (0.5)^2, etc. Wait, maybe this is a distribution with a standard deviation of 0.25, so variance is 0.0625? No, wait, maybe I made a mistake. Wait, let's re - examine. Wait, the graph: the x - axis has marks at 2.5, 3, 3.5, 4, 4.5, 5, 5.5. The distribution is symmetric around, say, 4? Let's assume the mean ($\mu$) is 4. Then the data points are around 3.5, 4, 4.5? Wait, no, the graph's peak is at 4, and it's symmetric. Let's consider the range of the data. If we assume that the data is in a range where the variance can be calculated. Wait, another approach: maybe this is a distribution related to a sample where the variance is calculated as follows. Wait, the options: 0.0625 is a small variance, 0.25 is larger. Wait, let's think about the possible variance. If the data is clustered closely around the mean, the variance is small. Let's check the options. The correct answer is 0.0625? No, wait, maybe I'm wrong. Wait, no, let's calculate. Wait, maybe the data has a standard deviation of 0.25, so variance is 0.25? No, variance is standard deviation squared. Wait, 0.25 squared is 0.0625, 0.5 squared is 0.25, 1 squared is 1, 1.2247 squared is about 1.5. Wait, maybe the data has a standard deviation of 0.25, so variance is 0.0625? No, that seems too small. Wait, maybe the data is in a range where the variance is 0.25. Wait, I think I made a mistake. Wait, let's look at the graph again. The x - axis: from 3 to 4.5? No, the graph starts at 3, goes up to 4, then down to 4.5? Wait, no, the graph is symmetric. Let's assume that the mean is 4. The distance from the mean to the edges of the distribution: if the standard deviation is 0.25, the data is within 4 ± 0.25 (3.75 to 4.25), but the graph shows data up to 3.5 and 4.5. Wait, maybe the standard deviation is 0.5, so variance is 0.25. Then the data is within 4 ± 0.5 (3.5 to 4.5), which matches the x - axis marks (3.5, 4, 4.5). So if the standard deviation ($\sigma$) is 0.5, then the variance ($\sigma^{2}$) is $0.5^{2}=0.25$. Wait, but le…

Snap & solve any problem in the app
Get step-by-step solutions on Sovi AI
Photo-based solutions with guided steps
Explore more problems and detailed explanations
0.25