QUESTION IMAGE
Question
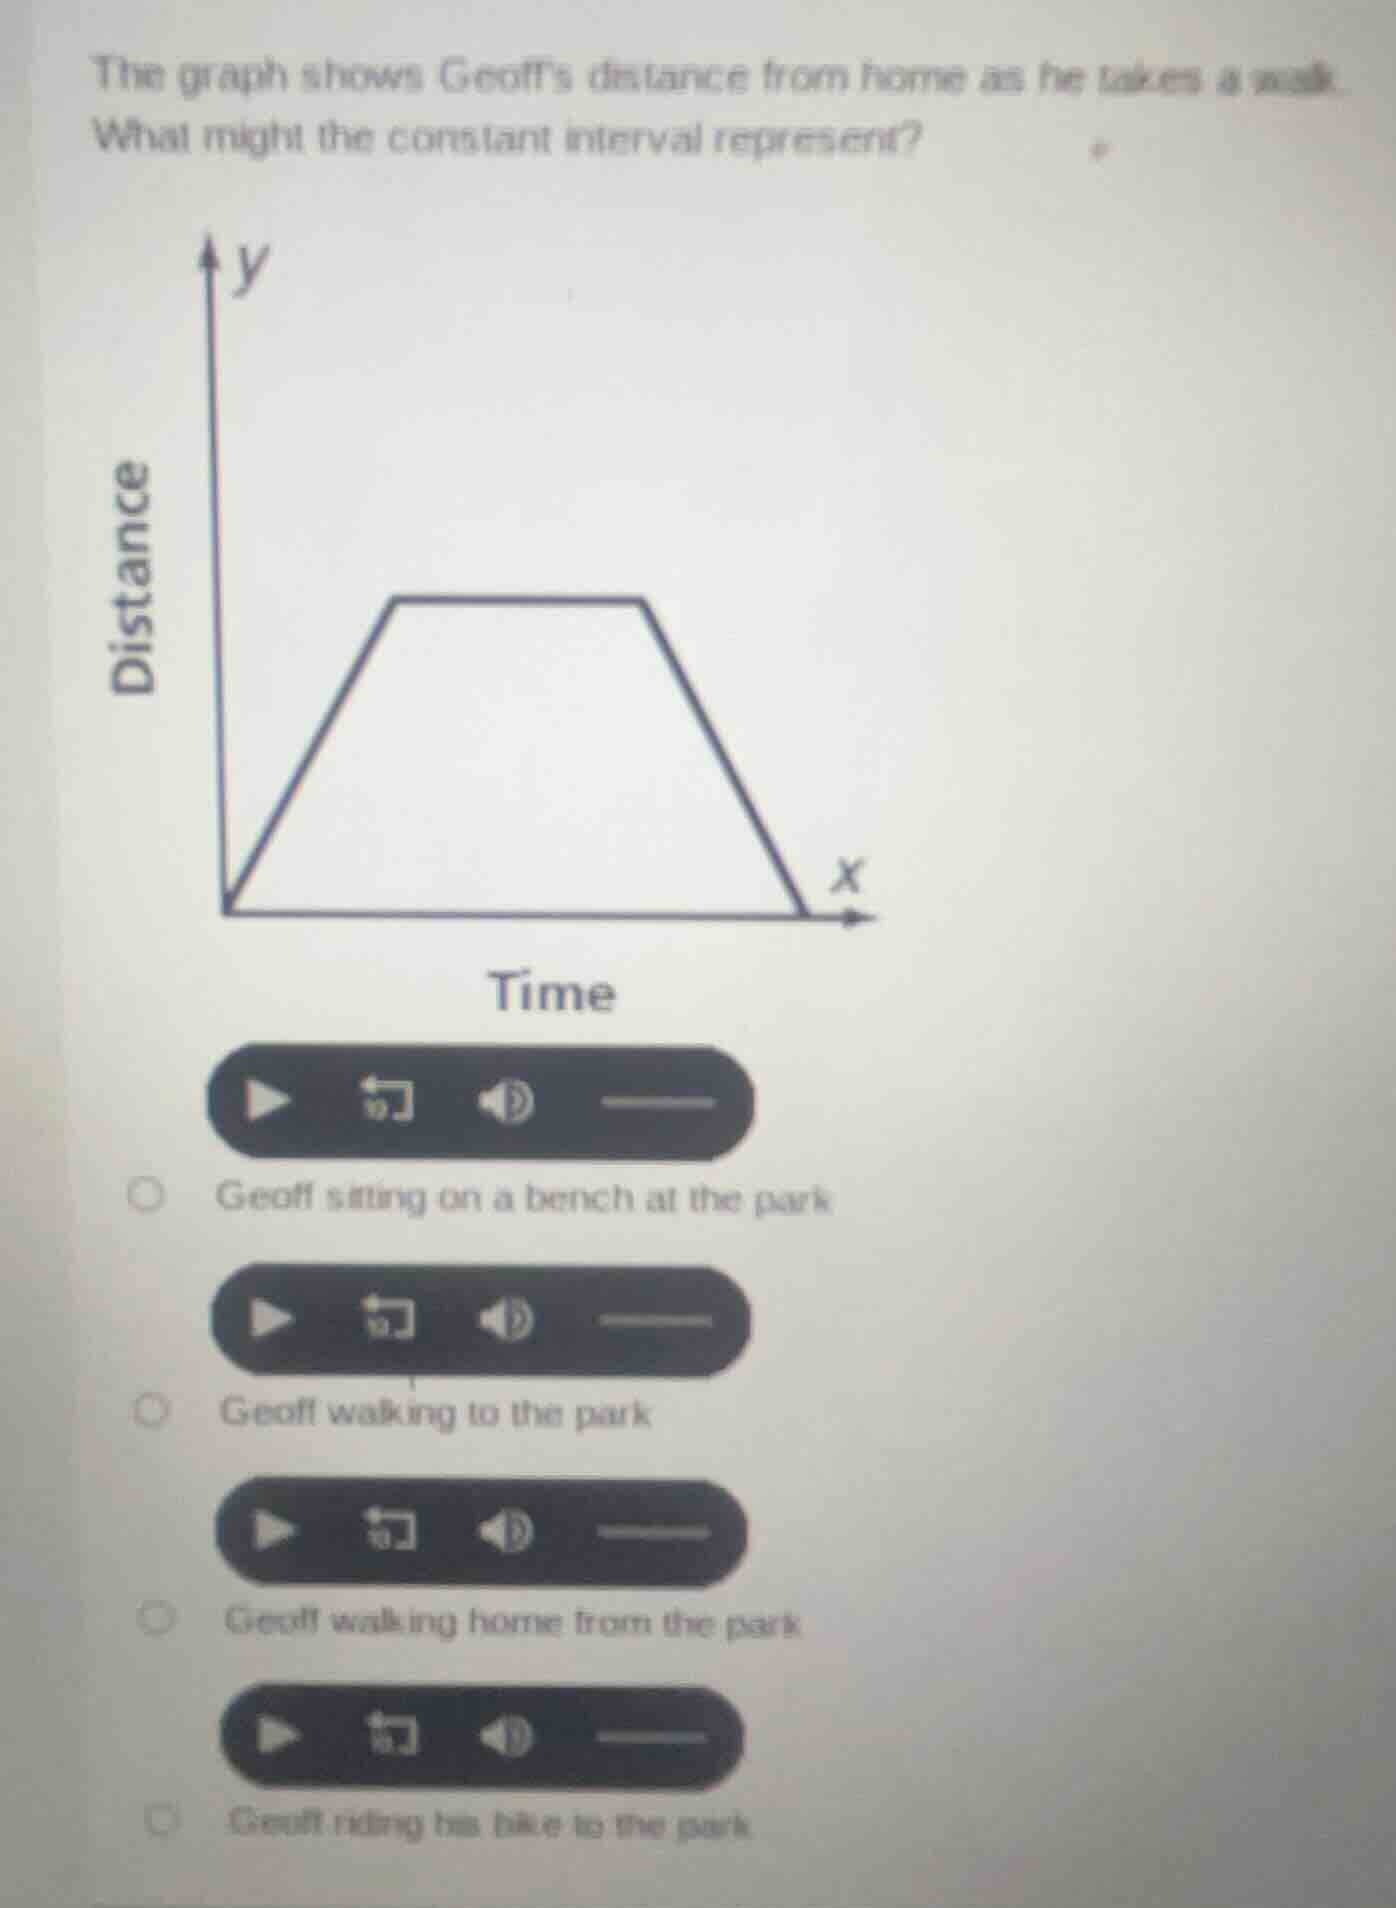
the graph shows geoffs distance from home as he takes a walk. what might the constant interval represent? distance time options: geoff sitting on a bench at the park; geoff walking to the park; geoff walking home from the park; geoff riding his bike to the park
Brief Explanations
In a distance - time graph, a constant interval (a horizontal line) means that the distance from the starting point (home, in this case) is not changing as time passes.
- If Geoff is walking to the park, his distance from home should be increasing, so the graph should have a positive slope, not a constant interval.
- If he is walking home from the park, his distance from home should be decreasing, so the graph should have a negative slope, not a constant interval.
- If he is riding his bike to the park, his distance from home should be increasing (with a steeper slope maybe, but still increasing), not constant.
- If he is sitting on a bench at the park, his distance from home remains the same while time passes, which is represented by a horizontal (constant) line on the distance - time graph.

Snap & solve any problem in the app
Get step-by-step solutions on Sovi AI
Photo-based solutions with guided steps
Explore more problems and detailed explanations
Geoff sitting on a bench at the park