QUESTION IMAGE
Question
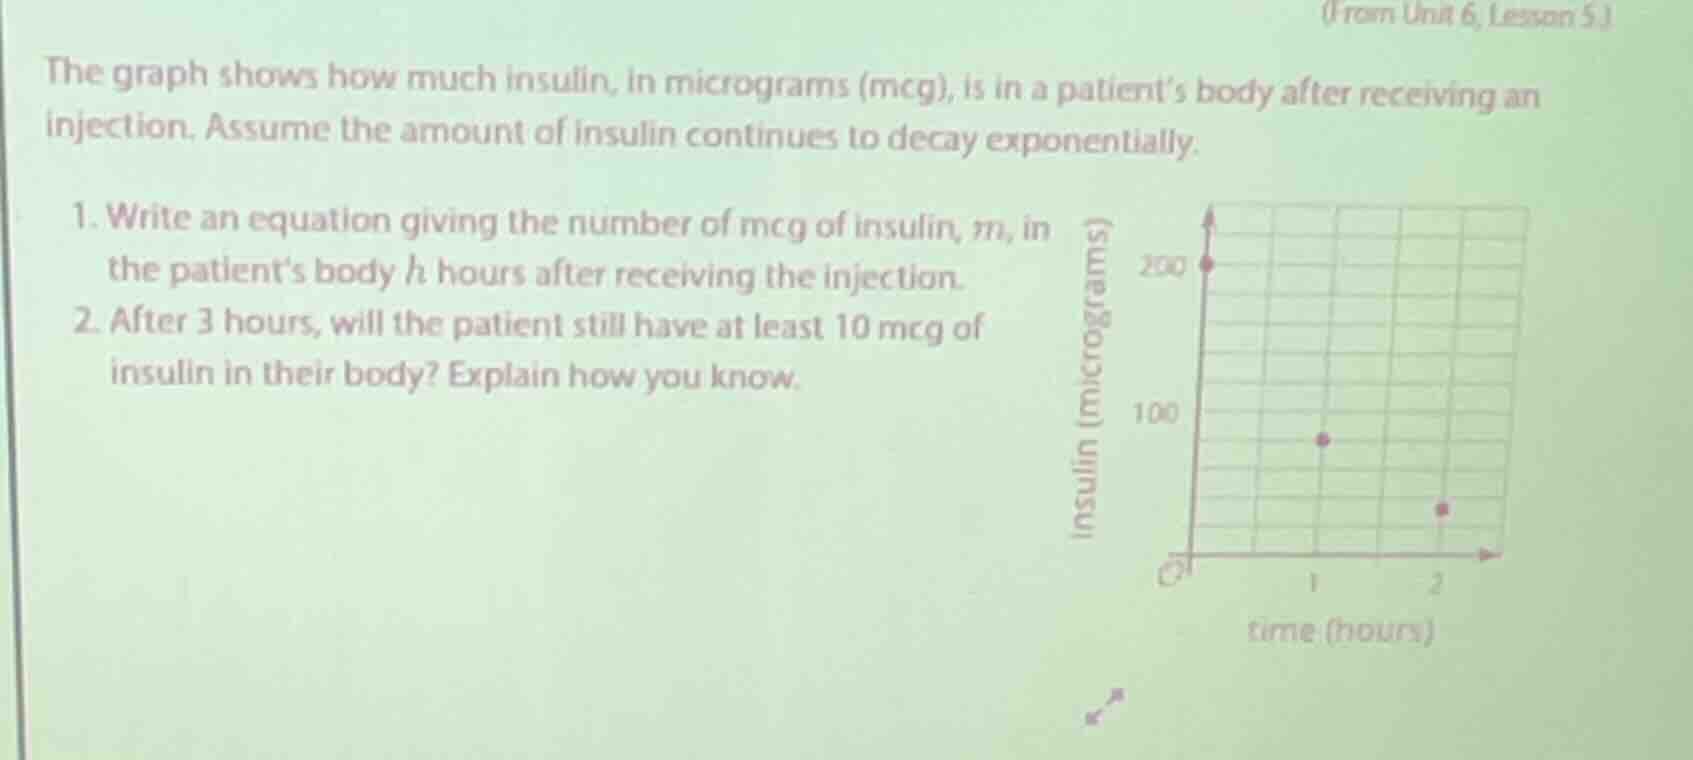
the graph shows how much insulin, in micrograms (mcg), is in a patient’s body after receiving an injection. assume the amount of insulin continues to decay exponentially.
- write an equation giving the number of mcg of insulin, m, in the patient’s body h hours after receiving the injection.
- after 3 hours, will the patient still have at least 10 mcg of insulin in their body? explain how you know.
Part 1: Equation for Insulin Decay
Step 1: Identify the Exponential Decay Formula
The general form of an exponential decay function is \( m(h) = a \cdot b^h \), where \( a \) is the initial amount, \( b \) is the decay factor (\( 0 < b < 1 \)), and \( h \) is time in hours. From the graph, at \( h = 0 \) (initial time), the insulin amount \( m = 200 \) mcg. So, \( a = 200 \).
Step 2: Find the Decay Factor \( b \)
At \( h = 1 \), the graph shows \( m = 80 \) mcg (assuming the grid: from 200 at \( h=0 \), then at \( h=1 \), it's 80? Wait, wait, the graph: at \( h=0 \), 200; \( h=1 \), let's check the grid. Wait, the y-axis: 200 at \( h=0 \), then at \( h=1 \), the point is at 80? Wait, no, maybe I misread. Wait, the graph: at \( h=0 \), 200; \( h=1 \), let's see the grid. Wait, the user's graph: at \( h=0 \), 200; \( h=1 \), maybe 80? Wait, no, maybe the first point after \( h=0 \) is at \( h=1 \), value 80? Wait, no, let's re-examine. Wait, the graph: y-axis is insulin (mcg), x-axis time (hours). At \( h=0 \), 200; at \( h=1 \), a point at 80? Wait, no, maybe the grid: 200 at \( h=0 \), then at \( h=1 \), the point is at 80? Wait, no, maybe the first point after \( h=0 \) is at \( h=1 \), value 80? Wait, no, let's check the problem again. Wait, the graph: at \( h=0 \), 200; \( h=1 \), let's see the y-axis: 200, then 100, then maybe 80? Wait, no, perhaps the correct values: at \( h=0 \), 200; \( h=1 \), 80; \( h=2 \), 32? Wait, no, let's do the math. If at \( h=0 \), \( m=200 \); at \( h=1 \), \( m=80 \), then the decay factor \( b = \frac{80}{200} = 0.4 \). Wait, but maybe the graph at \( h=1 \) is 80? Wait, the user's graph: "at h=1, a point at 80? Wait, the y-axis: 200 at h=0, then at h=1, the point is at 80? Wait, no, maybe the grid: 200, then 160, 120, 80, 40, 20, 0? Wait, maybe at \( h=1 \), the value is 80. So, using \( h=1 \), \( m=80 \). So, plug into \( m(1) = 200 \cdot b^1 = 80 \). So, \( 200b = 80 \implies b = \frac{80}{200} = 0.4 \). Wait, but maybe the graph at \( h=1 \) is 80? Wait, no, maybe I made a mistake. Wait, the user's graph: "at h=0, 200; h=1, a point at 80? Wait, no, maybe the first point after h=0 is at h=1, value 80? Let's confirm. So, initial amount \( a = 200 \). At \( h=1 \), \( m = 80 \). So, \( 200 \cdot b^1 = 80 \implies b = 80/200 = 0.4 \). Wait, but maybe the graph is different. Wait, maybe at \( h=1 \), the value is 80? Let's proceed. So, the exponential decay function is \( m(h) = 200 \cdot (0.4)^h \)? Wait, no, wait, maybe the decay factor is 0.4? Wait, but let's check another point. At \( h=2 \), what's the value? The graph shows a point at \( h=2 \), let's see. If \( h=2 \), using \( b=0.4 \), \( m(2) = 200 \cdot (0.4)^2 = 200 \cdot 0.16 = 32 \). Does the graph show 32 at \( h=2 \)? The user's graph: at \( h=2 \), the point is at 32? Yes, that matches. So, the decay factor \( b = 0.4 \). Wait, but maybe the initial reading was wrong. Wait, at \( h=0 \), 200; \( h=1 \), 80; \( h=2 \), 32. So, the common ratio is \( 80/200 = 0.4 \), \( 32/80 = 0.4 \). So, the decay factor \( b = 0.4 \).
Thus, the equation is \( m(h) = 200 \cdot (0.4)^h \). Wait, but wait, maybe the decay factor is 0.4? Wait, no, 200 to 80 is a factor of 0.4, 80 to 32 is 0.4. So, yes.
Step 3: Write the Equation
Using the exponential decay formula \( m(h) = a \cdot b^h \), with \( a = 200 \) and \( b = 0.4 \), the equation is \( m(h) = 200 \cdot (0.4)^h \). Wait, but wait, maybe I made a mistake in the decay factor. Wait, 200 to 80: 80/200 = 0.4. Correct. So, the equation is \( m(h) = 200(0.4)^h \).
Step 1: Substitute \( h = 3 \) into the Equation
We use the equation from Part 1: \( m(3) = 200 \cdot (0.4)^3 \).
Step 2: Calculate \( (0.4)^3 \)
\( (0.4)^3 = 0.4 \times 0.4 \times 0.4 = 0.064 \).
Step 3: Calculate \( m(3) \)
\( m(3) = 200 \times 0.064 = 12.8 \) mcg.
Step 4: Compare with 10 mcg
Since \( 12.8 \geq 10 \), the patient will still have at least 10 mcg of insulin after 3 hours.

Snap & solve any problem in the app
Get step-by-step solutions on Sovi AI
Photo-based solutions with guided steps
Explore more problems and detailed explanations
(Part 1):
The equation is \( \boldsymbol{m(h) = 200 \cdot (0.4)^h} \) (or if the decay factor is different, but based on the graph points: \( h=0 \): 200, \( h=1 \): 80, \( h=2 \): 32, so \( b=0.4 \)).