QUESTION IMAGE
Question
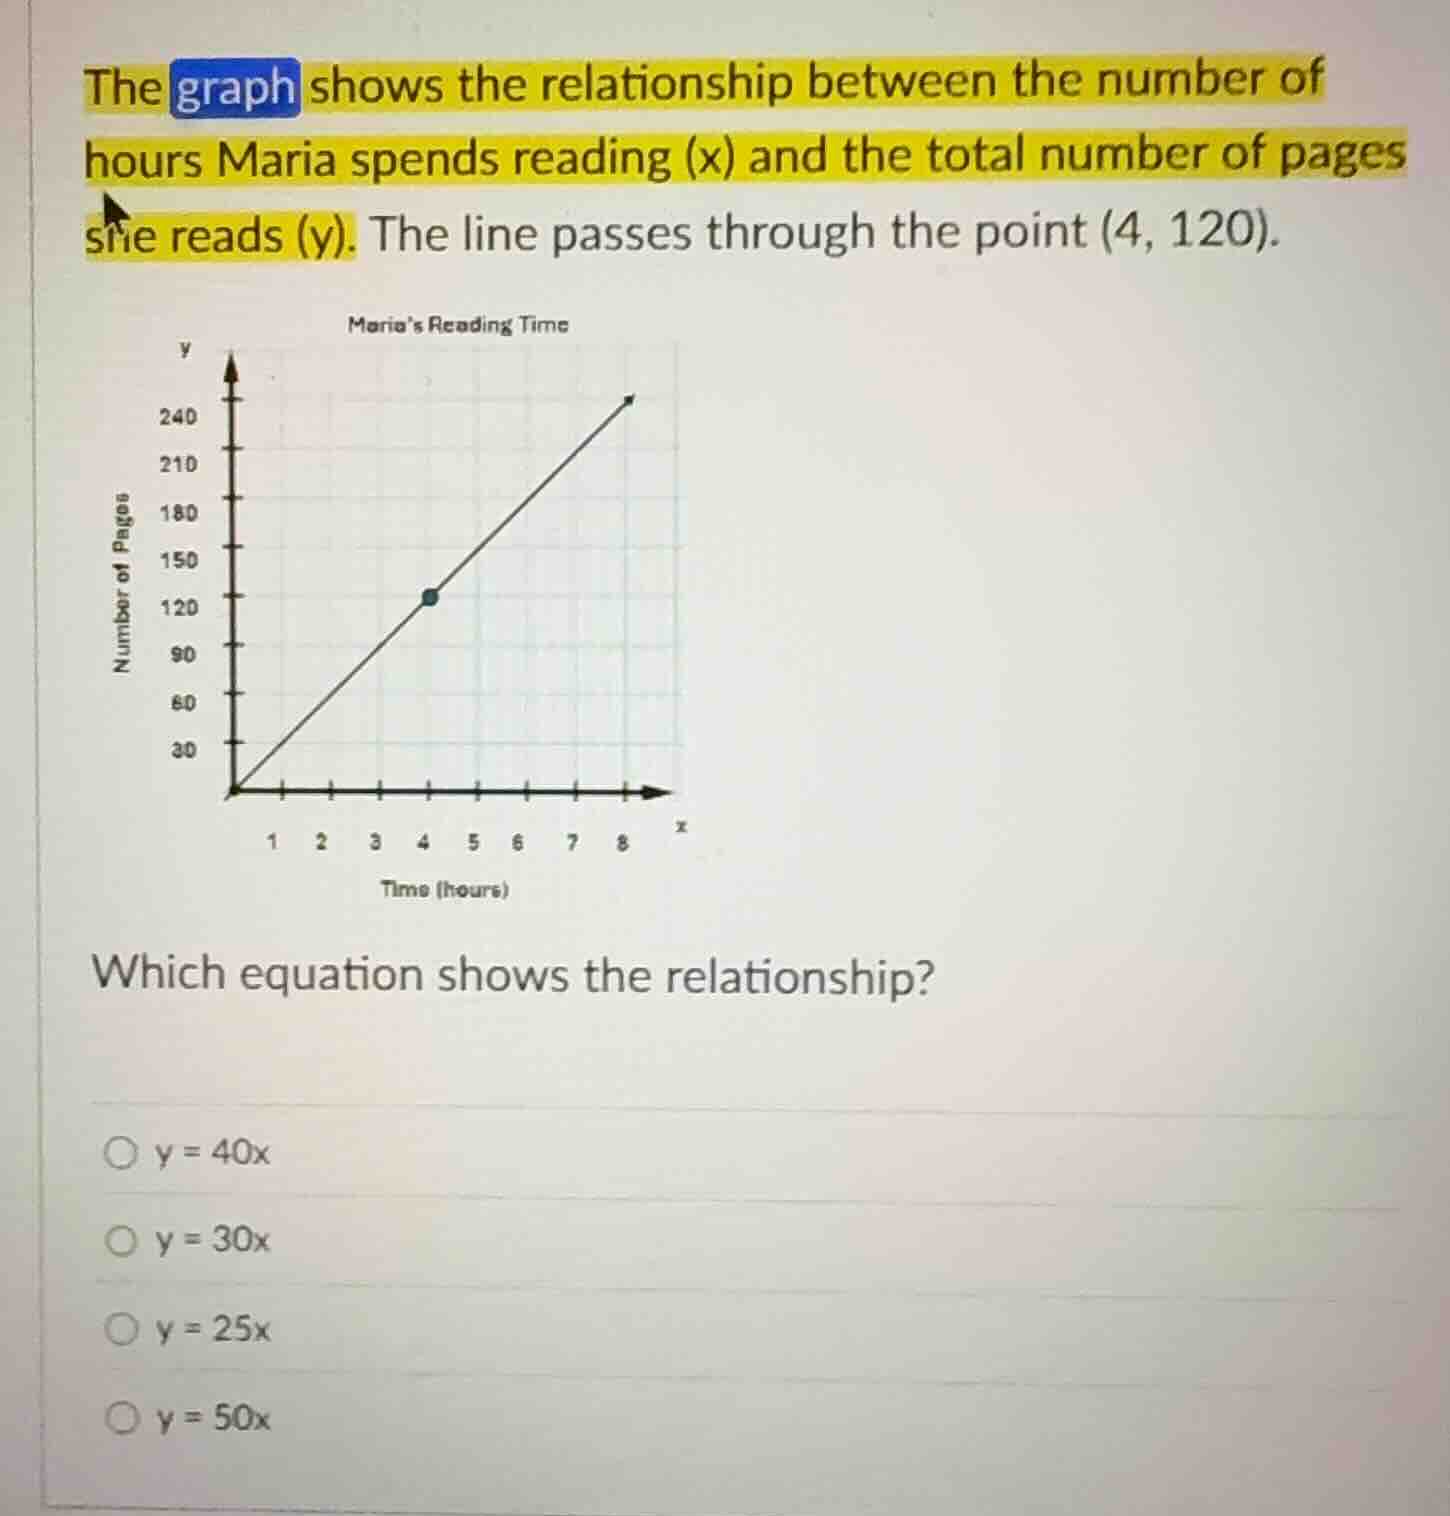
the graph shows the relationship between the number of hours maria spends reading (x) and the total number of pages she reads (y). the line passes through the point (4, 120).
marias reading time
which equation shows the relationship?
○ $y = 40x$
○ $y = 30x$
○ $y = 25x$
○ $y = 50x$
Step1: Recall the slope-intercept form
The graph is a straight line passing through the origin, so its equation is of the form \( y = mx \), where \( m \) is the slope (rate of change).
Step2: Calculate the slope using the point (4, 120)
The slope \( m \) is calculated as \( \frac{y}{x} \) for a point \( (x, y) \) on the line. Substituting \( x = 4 \) and \( y = 120 \), we get \( m=\frac{120}{4}=30 \).
Step3: Determine the equation
Since \( m = 30 \), the equation of the line is \( y = 30x \). We can also verify by plugging \( x = 4 \) into each option:
- For \( y = 40x \), \( y = 40\times4 = 160
eq120 \).
- For \( y = 30x \), \( y = 30\times4 = 120 \) (matches the point).
- For \( y = 25x \), \( y = 25\times4 = 100
eq120 \).
- For \( y = 50x \), \( y = 50\times4 = 200
eq120 \).

Snap & solve any problem in the app
Get step-by-step solutions on Sovi AI
Photo-based solutions with guided steps
Explore more problems and detailed explanations
\( y = 30x \) (the option with \( y = 30x \))