QUESTION IMAGE
Question
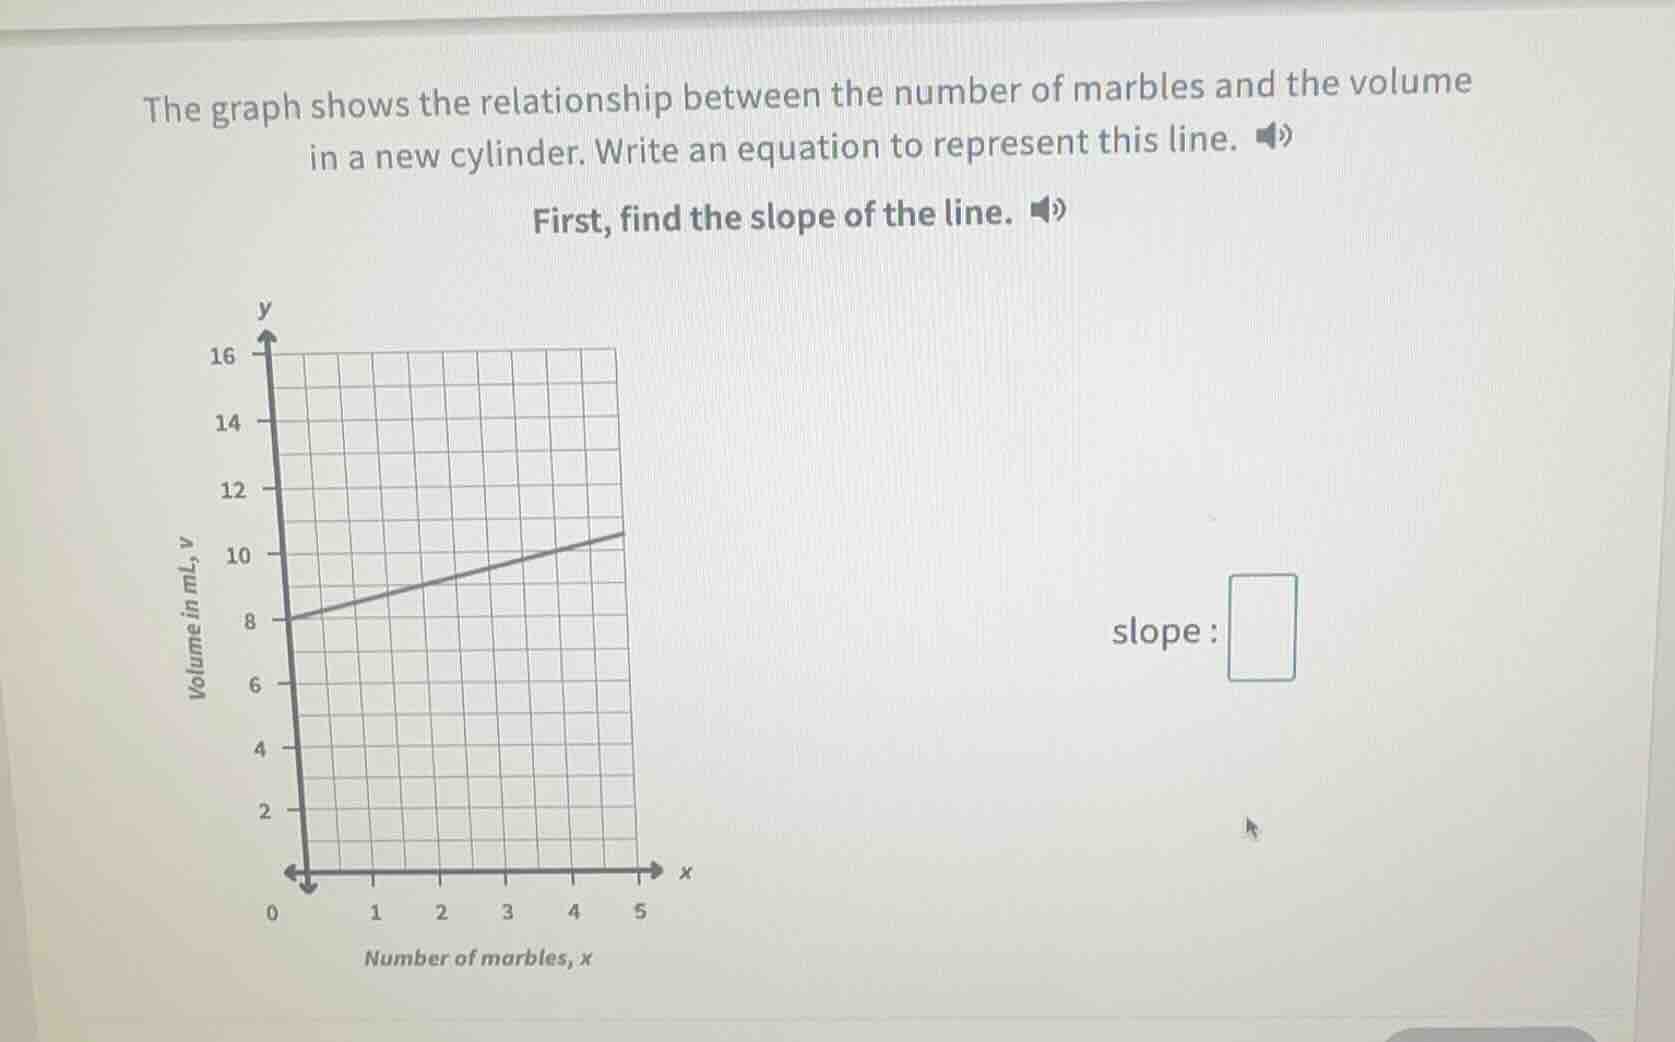
the graph shows the relationship between the number of marbles and the volume in a new cylinder. write an equation to represent this line. first, find the slope of the line. volume in ml, v number of marbles, x slope :
Step1: Identify two points on line
The line passes through $(0, 8)$ and $(5, 11)$.
Step2: Apply slope formula
Slope $m = \frac{y_2 - y_1}{x_2 - x_1}$
$m = \frac{11 - 8}{5 - 0}$
Step3: Calculate the slope
$m = \frac{3}{5} = 0.6$
Step4: Write line equation (slope-intercept)
Use $y = mx + b$, where $b=8$ (y-intercept)
$y = 0.6x + 8$ or $y = \frac{3}{5}x + 8$

Snap & solve any problem in the app
Get step-by-step solutions on Sovi AI
Photo-based solutions with guided steps
Explore more problems and detailed explanations
slope: $\frac{3}{5}$ or $0.6$
Equation of the line: $y = \frac{3}{5}x + 8$ (or $y = 0.6x + 8$)