QUESTION IMAGE
Question
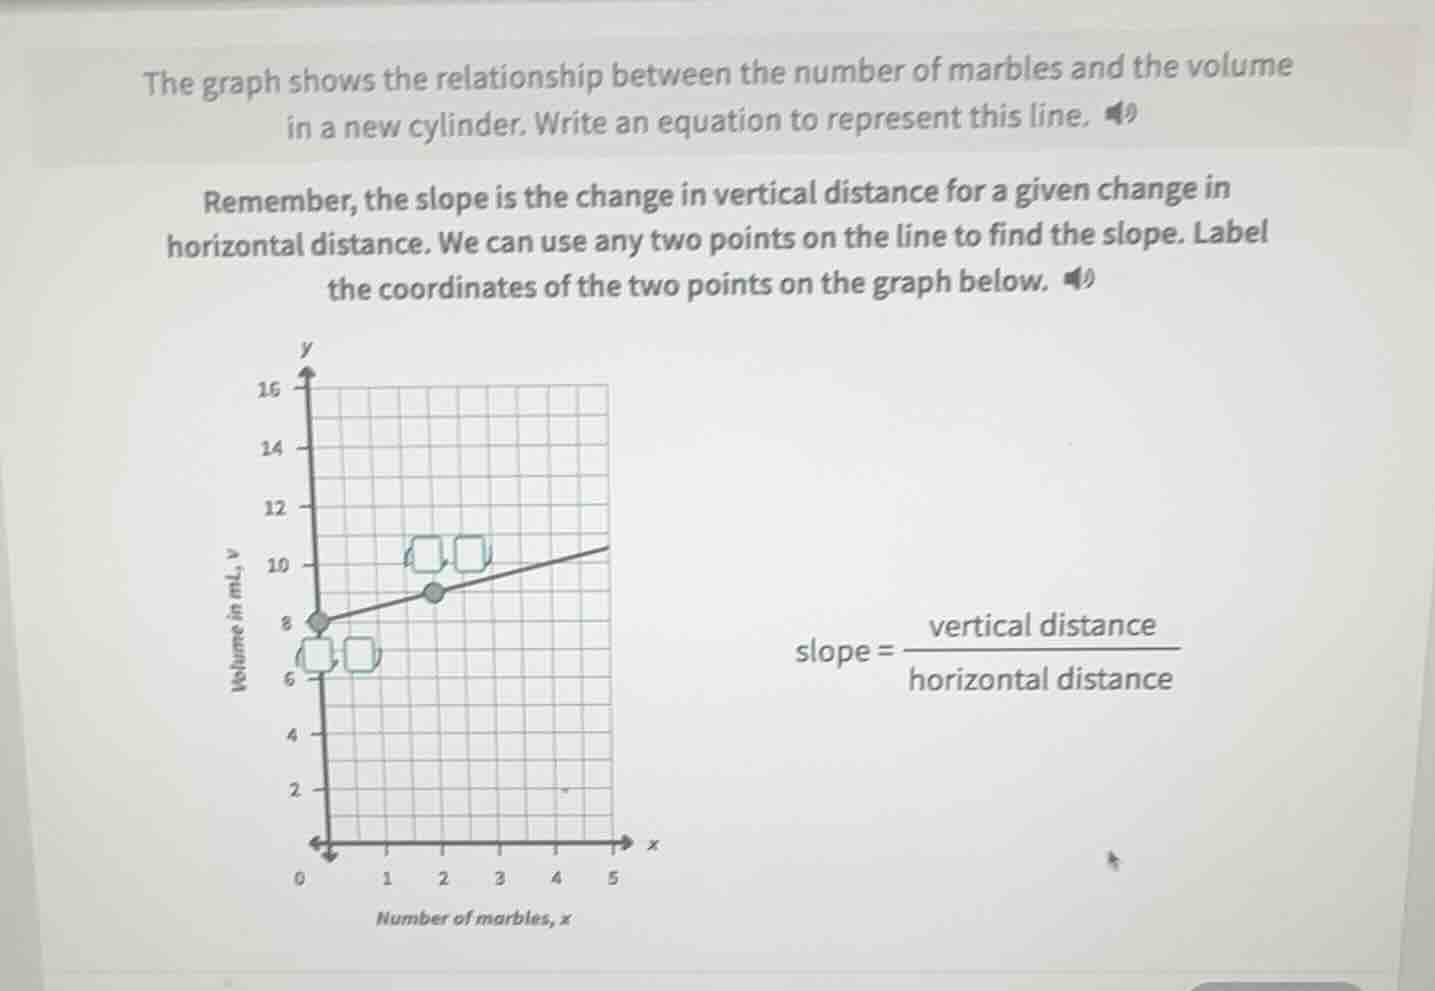
the graph shows the relationship between the number of marbles and the volume in a new cylinder. write an equation to represent this line. remember, the slope is the change in vertical distance for a given change in horizontal distance. we can use any two points on the line to find the slope. label the coordinates of the two points on the graph below. slope = \\(\frac{\text{vertical distance}}{\text{horizontal distance}}\\)
Step1: Identify two points
From the graph, the points are $(0, 8)$ and $(2, 9)$.
Step2: Calculate the slope
Use slope formula: $\text{slope} = \frac{y_2 - y_1}{x_2 - x_1}$
$\text{slope} = \frac{9 - 8}{2 - 0} = \frac{1}{2}$
Step3: Find y-intercept
The y-intercept $b$ is the y-value when $x=0$, so $b=8$.
Step4: Write line equation
Use $y = mx + b$, where $m$ is slope.
$y = \frac{1}{2}x + 8$

Snap & solve any problem in the app
Get step-by-step solutions on Sovi AI
Photo-based solutions with guided steps
Explore more problems and detailed explanations
The two labeled points are $(0, 8)$ and $(2, 9)$.
The equation of the line is $y = \frac{1}{2}x + 8$