QUESTION IMAGE
Question
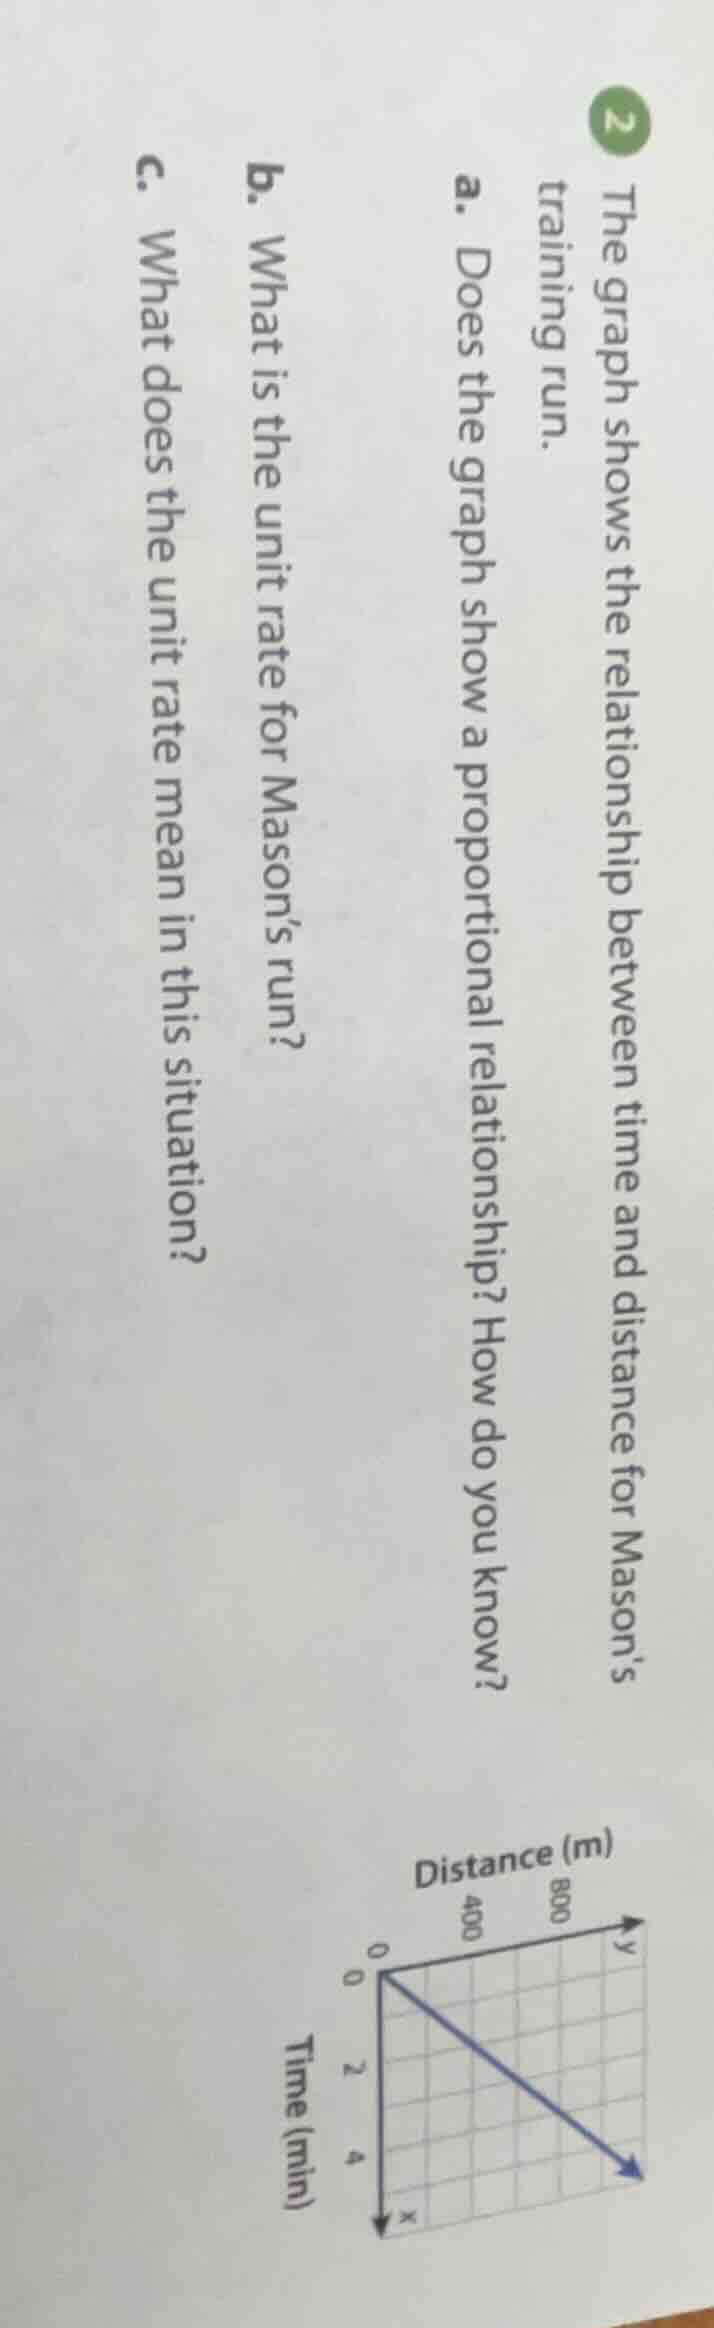
2 the graph shows the relationship between time and distance for mason’s training run.
a. does the graph show a proportional relationship? how do you know?
b. what is the unit rate for mason’s run?
c. what does the unit rate mean in this situation?
(there is a chart at the bottom with distance (m) on the y - axis (marked 0, 400, 800) and time (min) on the x - axis (marked 0, 2, 4), and a blue line starting from the origin.)
Step1: Check proportionality
A proportional relationship graph is a straight line passing through the origin (0,0). This graph is a straight line starting at (0,0), so it is proportional.
Step2: Calculate unit rate
Pick a point on the graph, e.g., (4 min, 800 m). Unit rate = $\frac{\text{Distance}}{\text{Time}} = \frac{800}{4}$
Step3: Define unit rate meaning
The unit rate represents distance per unit time.

Snap & solve any problem in the app
Get step-by-step solutions on Sovi AI
Photo-based solutions with guided steps
Explore more problems and detailed explanations
a. Yes, the graph shows a proportional relationship. It is a straight line that passes through the origin (0,0), which is the key characteristic of a proportional relationship.
b. $\frac{800}{4}=200$
The unit rate is 200 meters per minute.
c. The unit rate means Mason runs 200 meters every 1 minute during his training run.