QUESTION IMAGE
Question
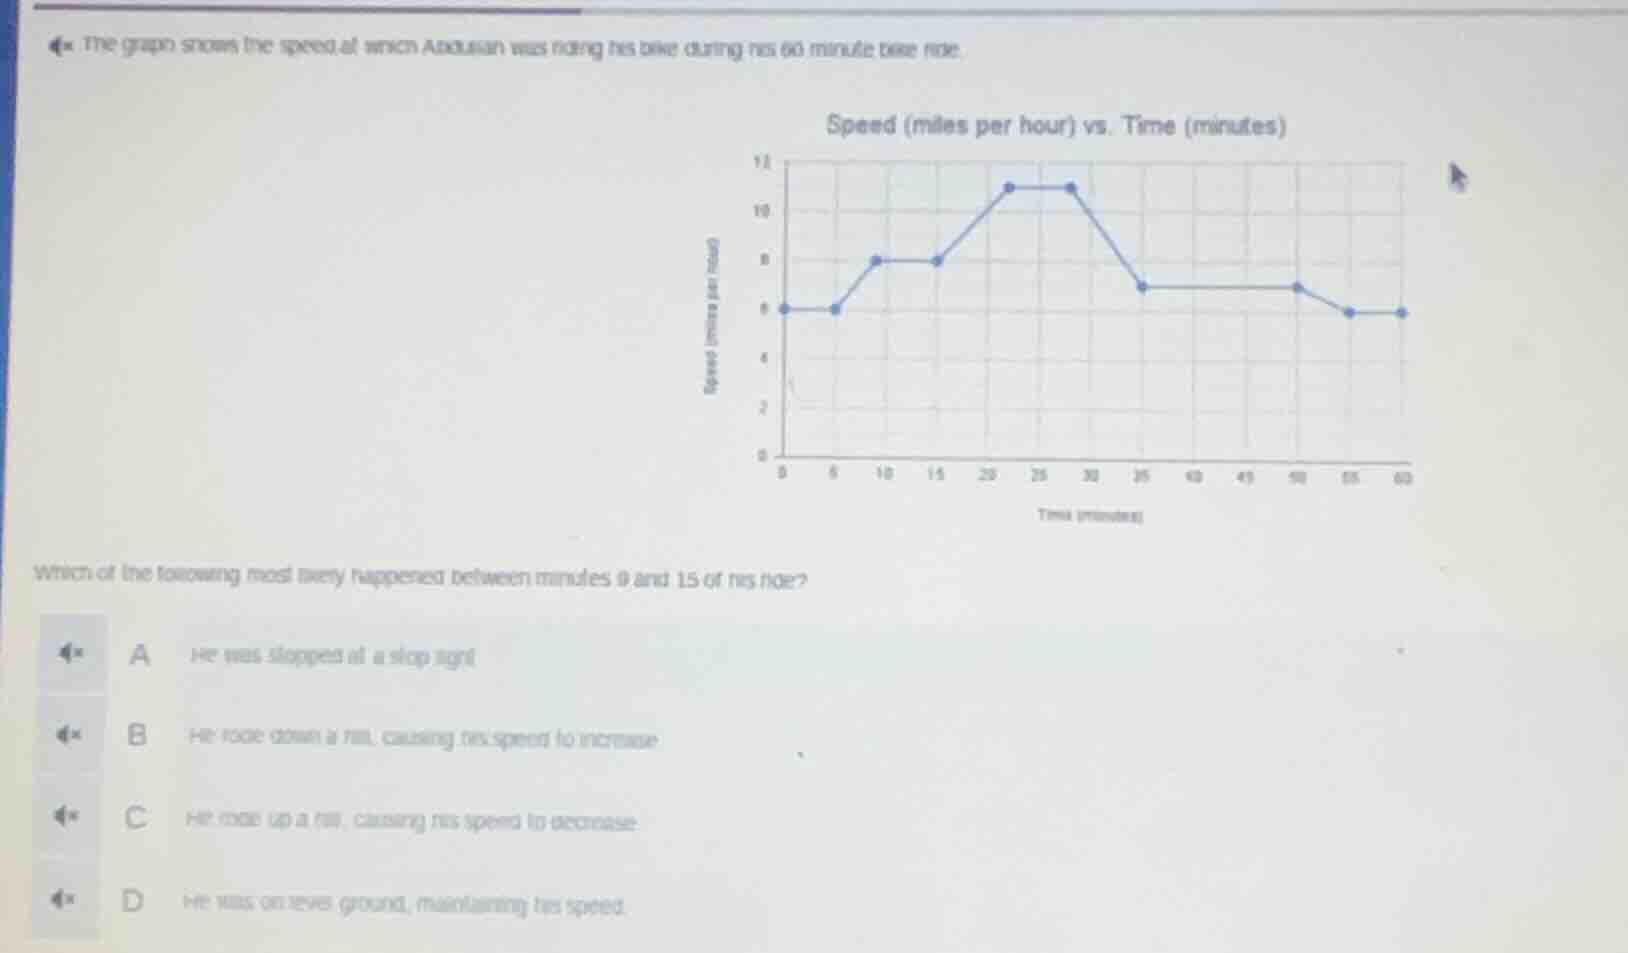
the graph shows the speed at which aadrian was riding his bike during his 60 - minute bike ride.
speed (miles per hour) vs. time (minutes)
which of the following most likely happened between minutes 0 and 15 of his ride?
a he was stopped at a stop sign
b he rode down a hill, causing his speed to increase
c he rode up a hill, causing his speed to decrease
d he was on level ground, maintaining his speed
Brief Explanations
To solve this, we analyze the speed - time graph between 0 and 15 minutes:
- Option A: If he was stopped at a stop sign, his speed would be 0. But from the graph, his speed is around 6 mph at 0 minutes and then increases to 8 mph by 10 - 15 minutes. So A is incorrect.
- Option B: When riding down a hill, gravitational force helps, so speed generally increases. From 0 - 15 minutes, the speed goes from 6 mph to 8 mph (with a small increase at 5 minutes and then a steady 8 mph from 10 - 15 minutes), which is an increase in speed. This is consistent with riding down a hill.
- Option C: Riding up a hill usually causes speed to decrease (as we have to work against gravity). But the speed here is increasing, so C is incorrect.
- Option D: On level ground, if maintaining speed, the speed - time graph should be a horizontal line. But here the speed is increasing (from 6 to 8 mph), so D is incorrect.

Snap & solve any problem in the app
Get step-by-step solutions on Sovi AI
Photo-based solutions with guided steps
Explore more problems and detailed explanations
B. He rode down a hill, causing his speed to increase