QUESTION IMAGE
Question
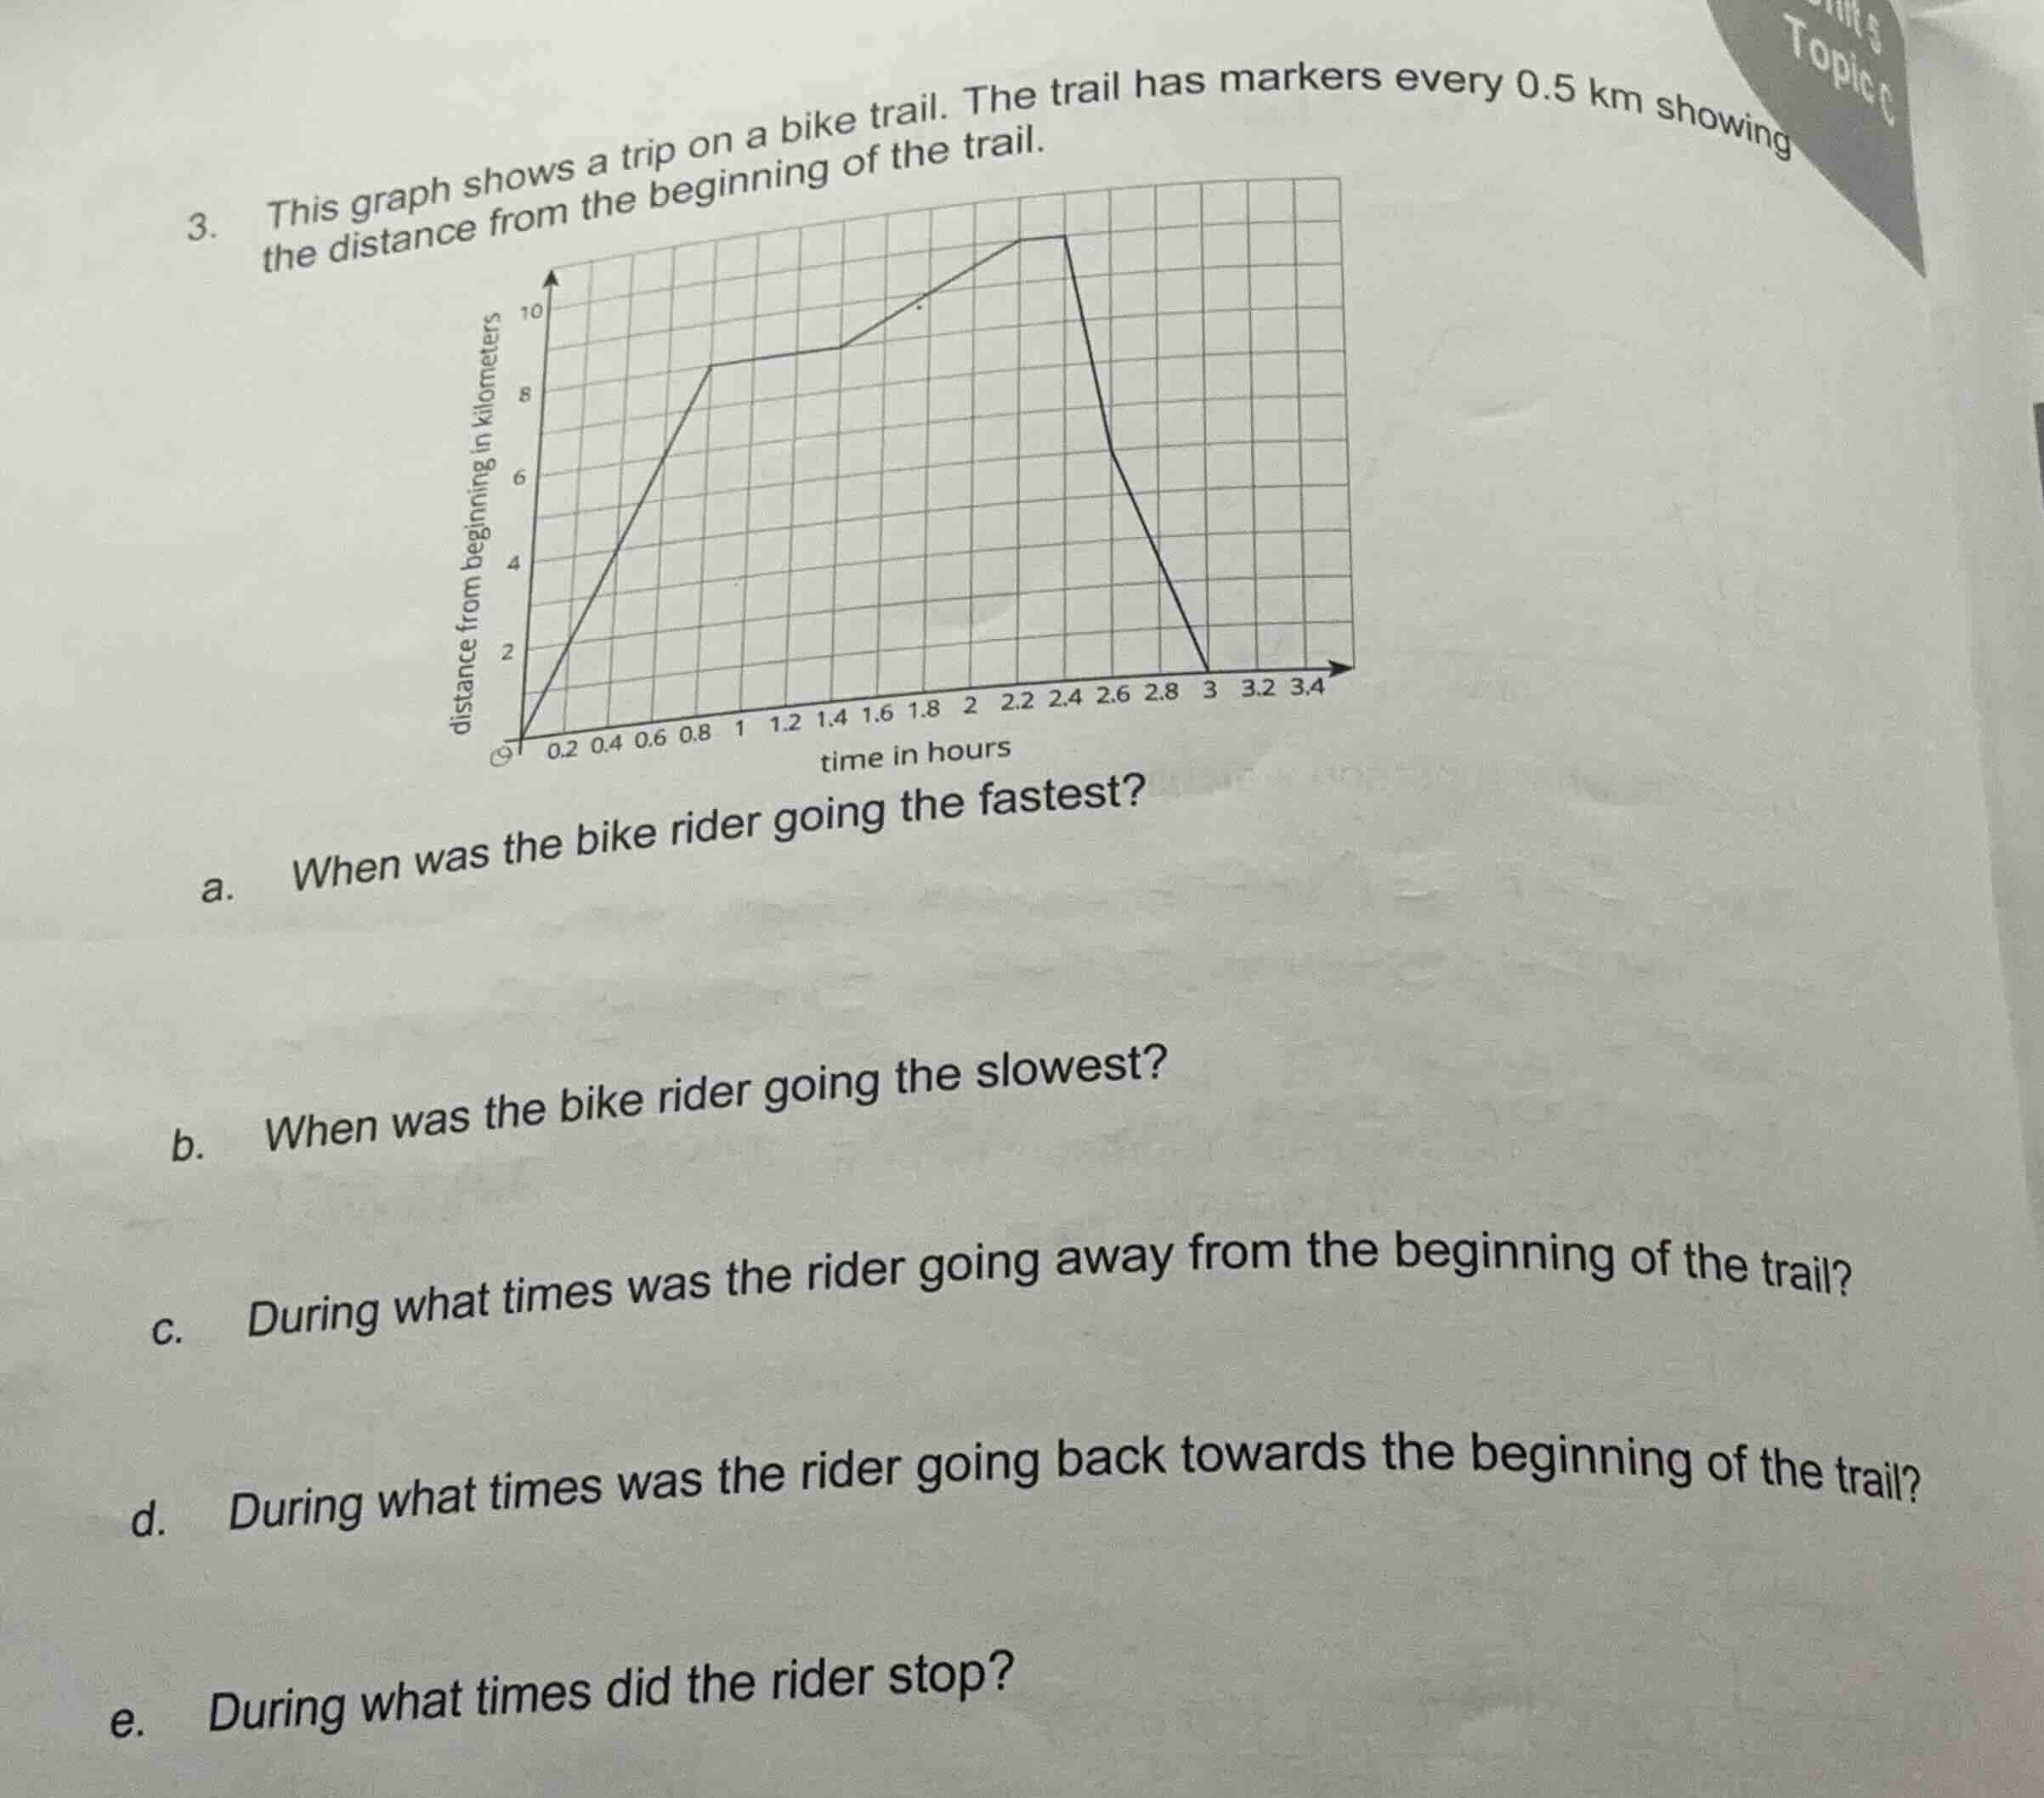
- this graph shows a trip on a bike trail. the trail has markers every 0.5 km showing the distance from the beginning of the trail.
a. when was the bike rider going the fastest?
b. when was the bike rider going the slowest?
c. during what times was the rider going away from the beginning of the trail?
d. during what times was the rider going back towards the beginning of the trail?
e. during what times did the rider stop?
Step1: Analyze graph slope for speed
Speed = $\frac{\text{Change in Distance}}{\text{Change in Time}}$, steeper slope = faster speed.
Step2: Identify fastest segment
Segment from 2.4 to 3.0 hours has the steepest negative slope (fastest speed, returning).
Step3: Identify slowest segment
Segment from 1.0 to 1.6 hours has the shallowest positive slope (slowest forward speed).
Step4: Identify outward travel times
Distance increases from 0 to 2.4 hours.
Step5: Identify return travel times
Distance decreases from 2.4 to 3.0 hours.
Step6: Identify stopped times
Distance is constant from 1.0 to 1.6 hours.

Snap & solve any problem in the app
Get step-by-step solutions on Sovi AI
Photo-based solutions with guided steps
Explore more problems and detailed explanations
a. Between 2.4 hours and 3.0 hours
b. Between 1.0 hours and 1.6 hours
c. Between 0 hours and 2.4 hours
d. Between 2.4 hours and 3.0 hours
e. Between 1.0 hours and 1.6 hours