QUESTION IMAGE
Question
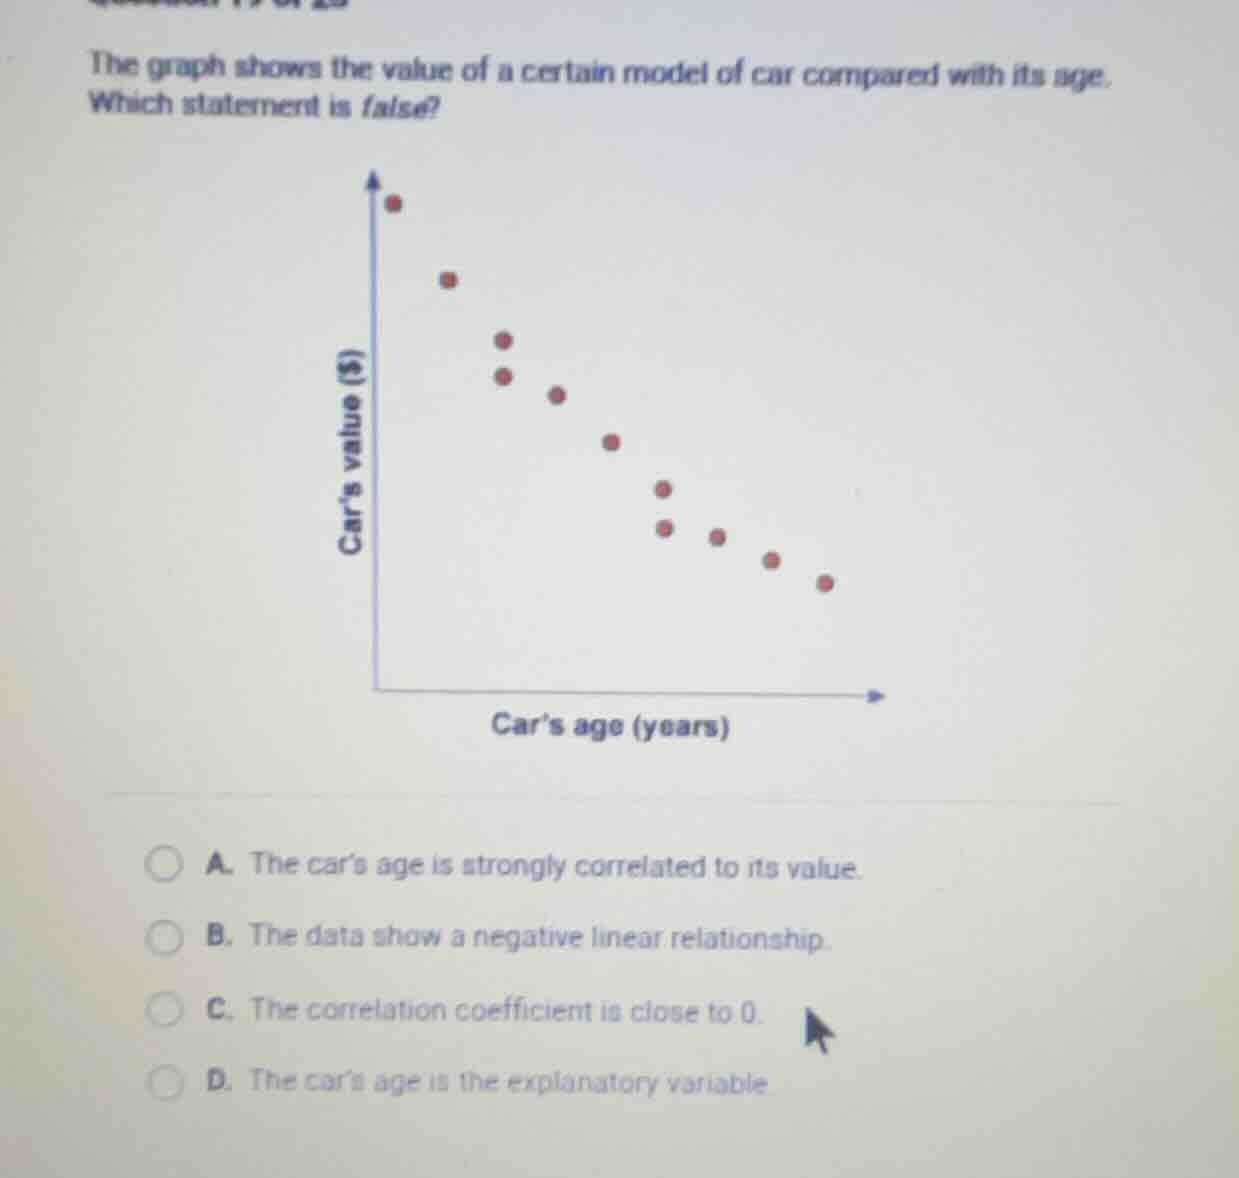
the graph shows the value of a certain model of car compared with its age.which statement is false?a. the cars age is strongly correlated to its value.b. the data show a negative linear relationship.c. the correlation coefficient is close to 0.d. the cars age is the explanatory variable.
Brief Explanations
- Option A: The points form a tight downward trend, so there is a strong correlation between car age and value. This is true.
- Option B: As car age (x-axis) increases, value (y-axis) decreases in a roughly straight pattern, so this is a negative linear relationship. This is true.
- Option C: A correlation coefficient close to 0 means no linear relationship, but the graph shows a clear strong linear trend. This is false.
- Option D: Car age is the variable used to explain changes in car value, so it is the explanatory variable. This is true.

Snap & solve any problem in the app
Get step-by-step solutions on Sovi AI
Photo-based solutions with guided steps
Explore more problems and detailed explanations
C. The correlation coefficient is close to 0.