QUESTION IMAGE
Question
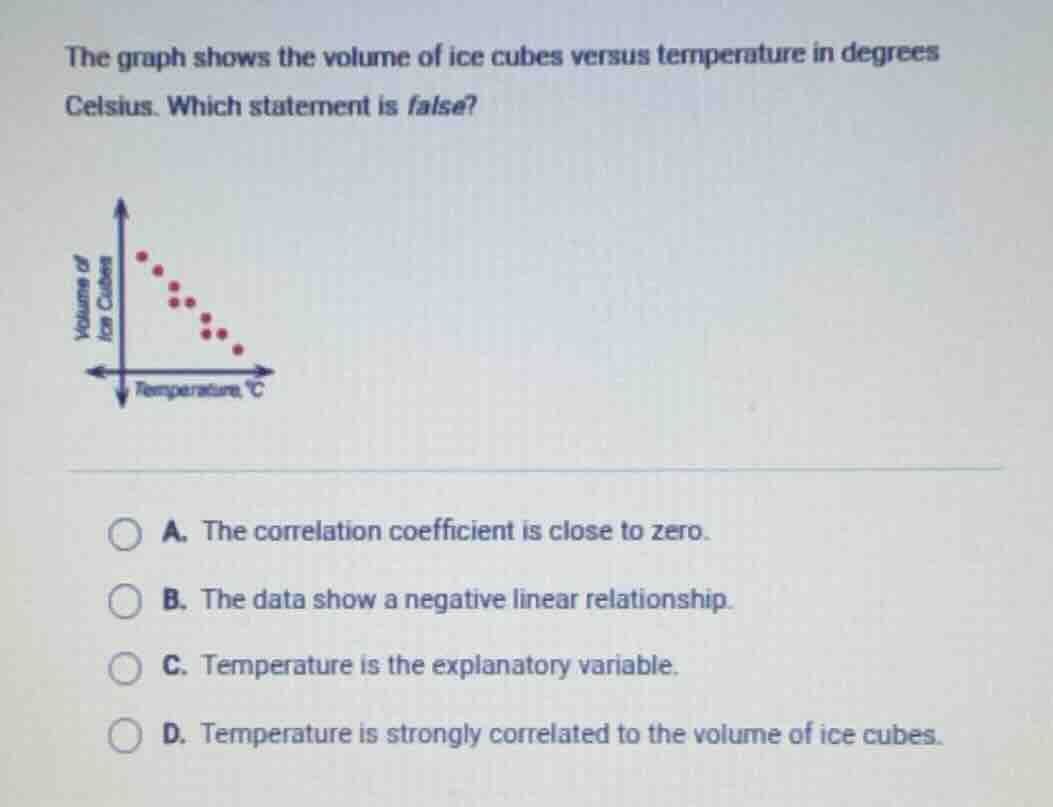
the graph shows the volume of ice cubes versus temperature in degrees celsius. which statement is false?
a. the correlation coefficient is close to zero.
b. the data show a negative linear relationship.
c. temperature is the explanatory variable.
d. temperature is strongly correlated to the volume of ice cubes.
Brief Explanations
- Option A: The scatter plot shows a clear downward linear trend, so the correlation coefficient is close to -1, not 0. This statement is false.
- Option B: As temperature increases, volume decreases, which is a negative linear relationship. This is true.
- Option C: Temperature is the independent (explanatory) variable plotted on the x-axis, explaining changes in volume. This is true.
- Option D: The tight, linear pattern means there is a strong correlation between temperature and volume. This is true.

Snap & solve any problem in the app
Get step-by-step solutions on Sovi AI
Photo-based solutions with guided steps
Explore more problems and detailed explanations
A. The correlation coefficient is close to zero.