QUESTION IMAGE
Question
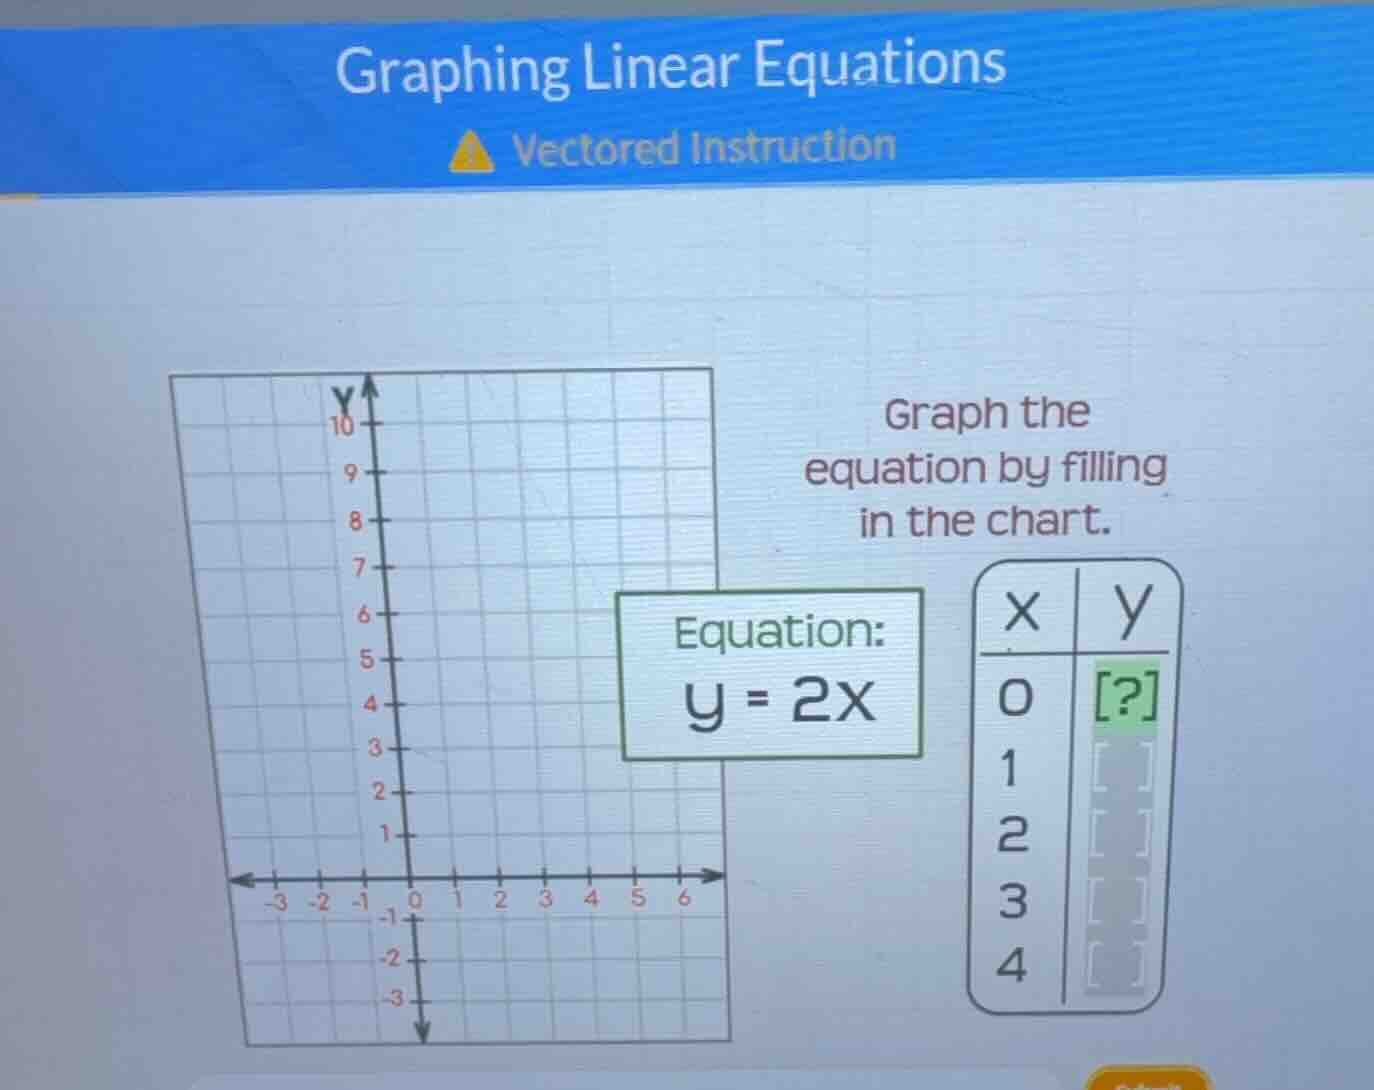
graphing linear equations
vectored instruction
graph the equation by filling in the chart.
equation: y = 2x
x | y
0 | ?
1 |
2 |
3 |
4 |
Step1: Substitute x = 0 into the equation
We have the equation \( y = 2x \). When \( x = 0 \), we substitute \( x \) with 0 in the equation. So, \( y = 2\times0 \).
Step2: Calculate the value of y
\( 2\times0 = 0 \), so when \( x = 0 \), \( y = 0 \).
For completeness, let's find y for other x values too:
- When \( x = 1 \): \( y = 2\times1 = 2 \)
- When \( x = 2 \): \( y = 2\times2 = 4 \)
- When \( x = 3 \): \( y = 2\times3 = 6 \)
- When \( x = 4 \): \( y = 2\times4 = 8 \)

Snap & solve any problem in the app
Get step-by-step solutions on Sovi AI
Photo-based solutions with guided steps
Explore more problems and detailed explanations
For \( x = 0 \), \( y = 0 \); for \( x = 1 \), \( y = 2 \); for \( x = 2 \), \( y = 4 \); for \( x = 3 \), \( y = 6 \); for \( x = 4 \), \( y = 8 \) (The value for the green box is 0)