QUESTION IMAGE
Question
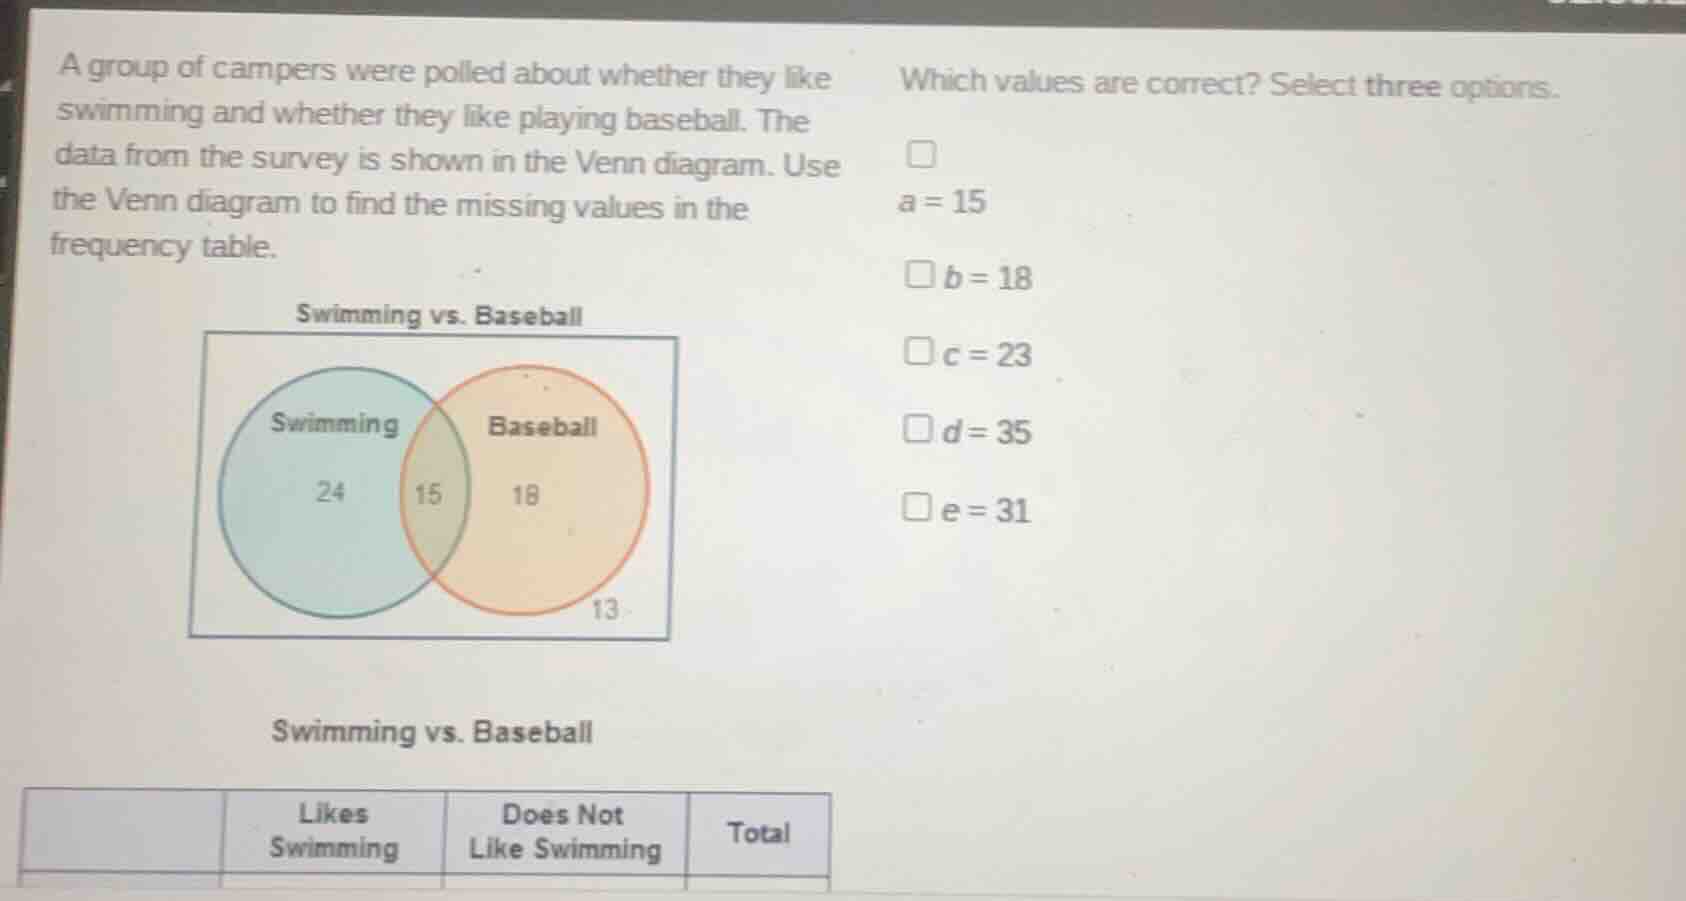
a group of campers were polled about whether they like swimming and whether they like playing baseball. the data from the survey is shown in the venn diagram. use the venn diagram to find the missing values in the frequency table.
swimming vs. baseball
venn diagram: swimming circle has 24, overlap has 15, baseball circle has 18, outside both has 13
swimming vs. baseball
frequency table with columns: likes swimming, does not like swimming, total
which values are correct? select three options.
- a = 15
- b = 18
- c = 23
- d = 35
- e = 31
Step1: Define table rows/columns
The table has rows: Likes Baseball, Does Not Like Baseball, Total; columns: Likes Swimming, Does Not Like Swimming, Total.
Step2: Calculate a (Likes both)
$a$ = overlap of Venn circles: $a=15$
Step3: Calculate b (Likes baseball, no swim)
$b$ = baseball-only in Venn: $b=18$
Step4: Calculate c (No swim, no baseball)
$c$ = outside both circles: $c=13$
Step5: Calculate d (Total likes swimming)
$d$ = swim-only + both: $d=24+15=39$
Step6: Calculate e (Total no swimming)
$e$ = baseball-only + neither: $e=18+13=31$
Step7: Verify correct values
Match calculated values to options: $a=15$, $b=18$, $e=31$ are correct.

Snap & solve any problem in the app
Get step-by-step solutions on Sovi AI
Photo-based solutions with guided steps
Explore more problems and detailed explanations
a = 15, b = 18, e = 31