QUESTION IMAGE
Question
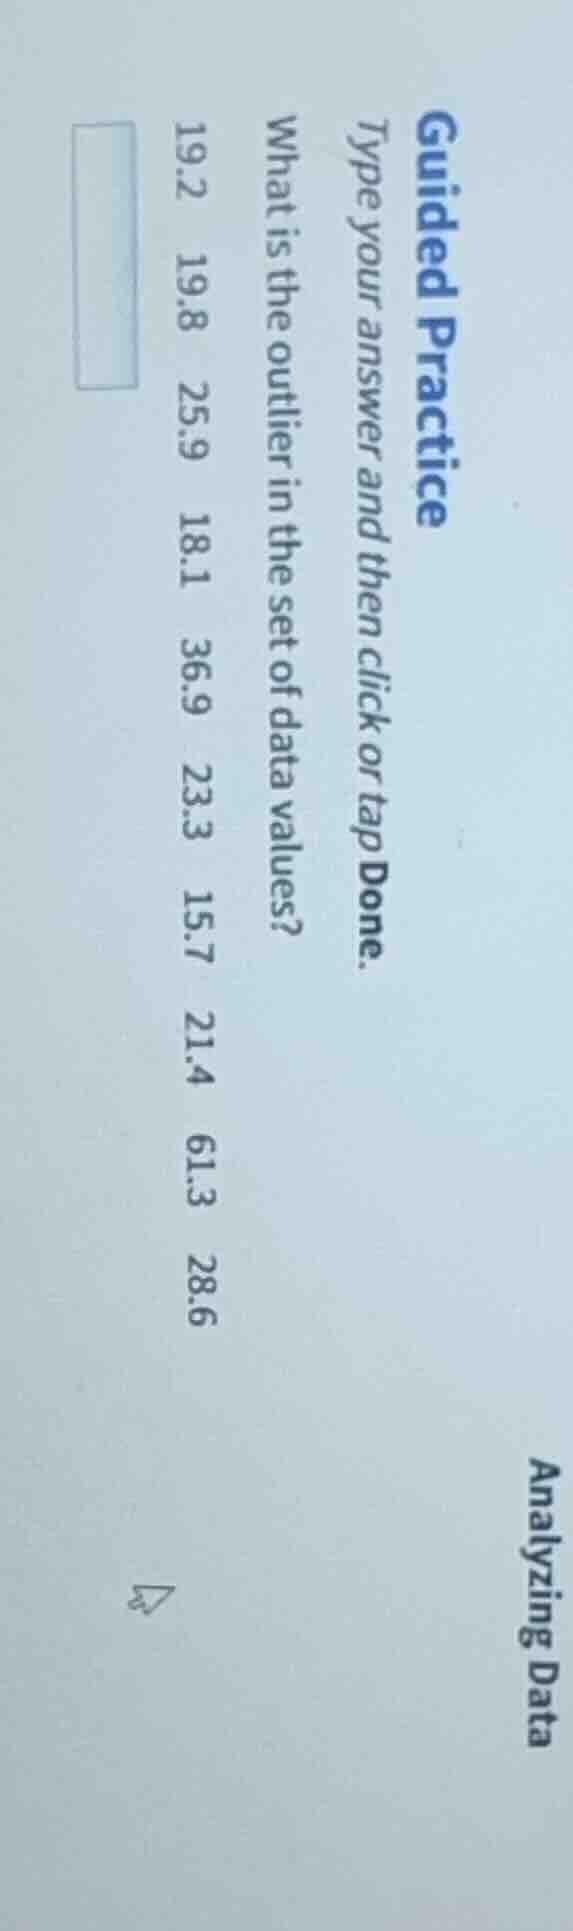
guided practice
type your answer and then click or tap done.
what is the outlier in the set of data values?
19.2 19.8 25.9 18.1 36.9 23.3 15.7 21.4 61.3 28.6
Step1: Ordenar los datos
$15.7, 18.1, 19.2, 19.8, 21.4, 23.3, 25.9, 28.6, 36.9, 61.3$
Step2: Calcular la mediana
La mediana es $\frac{21.4 + 23.3}{2} = 22.35$
Step3: Calcular Q1 y Q3
Q1 (mediana de la mitad inferior): $\frac{18.1 + 19.2}{2} = 18.65$
Q3 (mediana de la mitad superior): $\frac{25.9 + 28.6}{2} = 27.25$
Step4: Calcular rango intercuartílico
$IQR = Q3 - Q1 = 27.25 - 18.65 = 8.6$
Step5: Definir límites de valores atípicos
Límite inferior: $Q1 - 1.5 \times IQR = 18.65 - 1.5 \times 8.6 = 5.75$
Límite superior: $Q3 + 1.5 \times IQR = 27.25 + 1.5 \times 8.6 = 40.15$
Step6: Identificar el valor atípico
Solo 61.3 supera el límite superior de 40.15.

Snap & solve any problem in the app
Get step-by-step solutions on Sovi AI
Photo-based solutions with guided steps
Explore more problems and detailed explanations
61.3