QUESTION IMAGE
Question
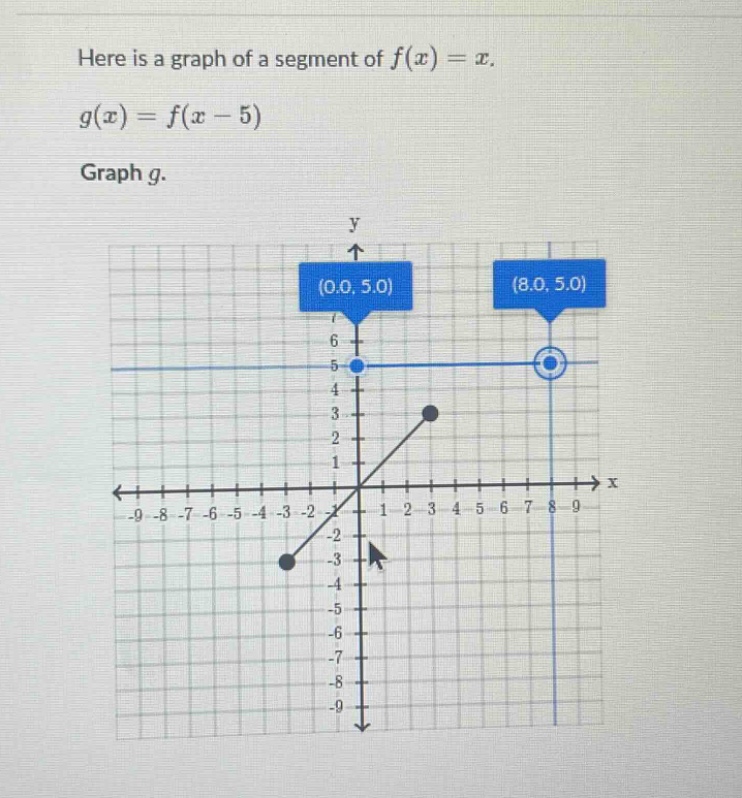
here is a graph of a segment of $f(x) = x$.
$g(x) = f(x - 5)$
graph $g$.
graph with coordinates (0.0, 5.0), (8.0, 5.0), a line segment of $f(x)=x$ and grid lines
Step1: Understand the transformation
The function \( g(x) = f(x - 5) \) represents a horizontal shift of the function \( f(x) \). For a function \( y = f(x - h) \), it is a shift to the right by \( h \) units when \( h>0 \). Here, \( h = 5 \), so we shift the graph of \( f(x)=x \) 5 units to the right.
Step2: Find key points of \( f(x) \)
First, identify the key points of the original function \( f(x)=x \). From the graph, we can see the segment of \( f(x) \) has endpoints (let's assume the left endpoint is \( (-2, -2) \) and the right endpoint is \( (3, 3) \))? Wait, looking at the graph, the line \( f(x)=x \) has a segment with a black dot at, say, when \( x = 3 \), \( y = 3 \)? Wait, no, the graph shows the line \( f(x)=x \) with a black dot at (3,3)? Wait, actually, looking at the grid, the original \( f(x)=x \) segment: let's find the endpoints. The left endpoint (the black dot) seems to be at \( x=-2 \), \( y = -2 \) (since \( f(-2)=-2 \)) and the right endpoint (the black dot) at \( x = 3 \), \( y = 3 \) (since \( f(3)=3 \))? Wait, maybe better to take the two endpoints of the \( f(x) \) segment. Let's check the coordinates: the leftmost point of \( f(x) \) is at \( (-2, -2) \) (black dot) and the rightmost point is at \( (3, 3) \) (black dot).
Step3: Apply the shift
To shift these points 5 units to the right, we add 5 to the x - coordinates of each point.
For the left endpoint \( (-2, -2) \): new x - coordinate is \( -2+5 = 3 \), so the new point is \( (3, -2) \).
For the right endpoint \( (3, 3) \): new x - coordinate is \( 3 + 5=8 \), so the new point is \( (8, 3) \).
Also, the blue horizontal line is \( y = 5 \), but that's a different function? Wait, no, the problem is about \( g(x)=f(x - 5) \), where \( f(x) \) is the line \( y = x \). So we focus on the segment of \( f(x)=x \).
Wait, maybe the original \( f(x) \) segment has endpoints: let's look at the graph again. The line \( f(x)=x \) has a black dot at (3,3) and another at (-2, -2). So to graph \( g(x)=f(x - 5) \), we shift each point of \( f(x) \) 5 units right.
So the left endpoint of \( f(x) \): let's say the left endpoint is at \( x=-2 \), \( y = -2 \) (since \( f(-2)=-2 \)) and the right endpoint at \( x = 3 \), \( y = 3 \) (since \( f(3)=3 \)).
Shifting right by 5:
Left endpoint: \( (-2 + 5, -2)=(3, -2) \)
Right endpoint: \( (3+5, 3)=(8, 3) \)
So the graph of \( g(x)=f(x - 5) \) is the line segment connecting \( (3, -2) \) and \( (8, 3) \), with the same slope (slope of \( f(x) \) is 1, so slope of \( g(x) \) is also 1) and shifted right by 5 units.

Snap & solve any problem in the app
Get step-by-step solutions on Sovi AI
Photo-based solutions with guided steps
Explore more problems and detailed explanations
To graph \( g(x)=f(x - 5) \), we shift the graph of \( f(x)=x \) 5 units to the right. The endpoints of the segment of \( f(x) \) (e.g., \((-2, -2)\) and \((3, 3)\)) are shifted to \((3, -2)\) and \((8, 3)\) respectively. The graph of \( g(x) \) is a line segment with slope 1, connecting \((3, -2)\) (left endpoint) and \((8, 3)\) (right endpoint). (Note: When graphing, plot these two points and draw a line segment between them with slope 1, consistent with the original \( f(x)=x \) line.)