QUESTION IMAGE
Question
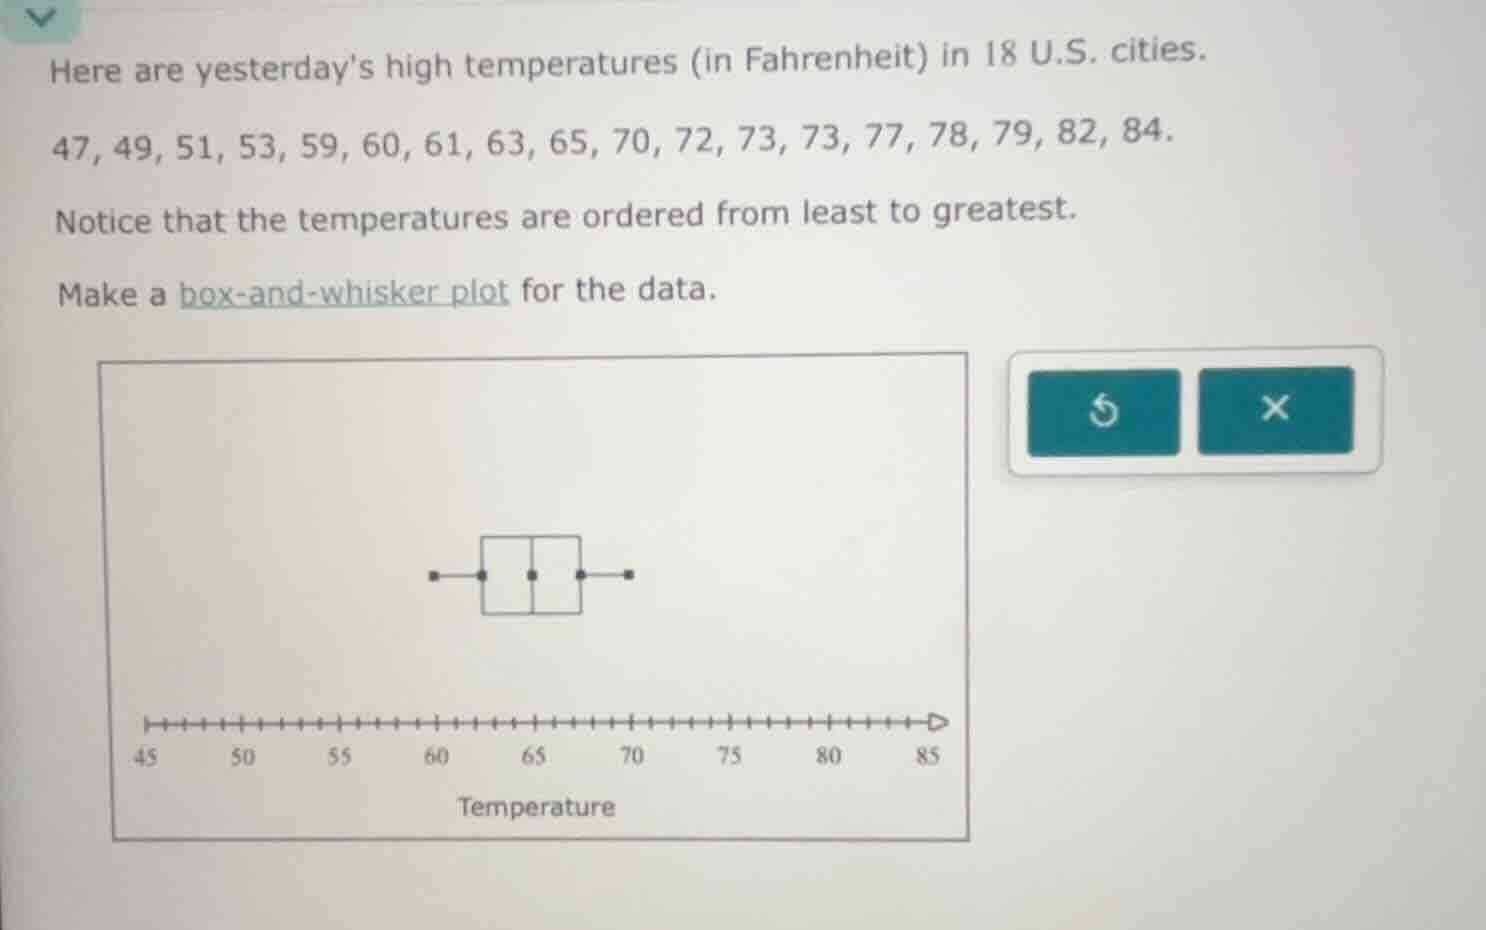
here are yesterdays high temperatures (in fahrenheit) in 18 u.s. cities.47, 49, 51, 53, 59, 60, 61, 63, 65, 70, 72, 73, 73, 77, 78, 79, 82, 84.notice that the temperatures are ordered from least to greatest.make a box-and-whisker plot for the data.
Step1: Find minimum value
The smallest data point is 47.
Step2: Find maximum value
The largest data point is 84.
Step3: Calculate median (Q2)
For 18 data points, median is average of 9th and 10th values:
$$\text{Median} = \frac{70 + 72}{2} = 71$$
Step4: Calculate Q1 (lower quartile)
Q1 is median of first 9 values (1st to 9th):
1st-9th values: 47,49,51,53,59,60,61,63,65
Q1 = 59
Step5: Calculate Q3 (upper quartile)
Q3 is median of last 9 values (10th to 18th):
10th-18th values:72,73,73,77,78,79,82,84
Q3 = 78
Step6: Map values to plot
- Left whisker end: 47
- Left box edge: 59
- Box middle line: 71
- Right box edge: 78
- Right whisker end: 84

Snap & solve any problem in the app
Get step-by-step solutions on Sovi AI
Photo-based solutions with guided steps
Explore more problems and detailed explanations
The box-and-whisker plot is constructed with:
- Minimum (left whisker): 47
- Lower quartile (left box boundary): 59
- Median (box center line): 71
- Upper quartile (right box boundary): 78
- Maximum (right whisker): 84
When plotted on the provided axis:
- Draw a whisker from 47 to 59
- Draw a box from 59 to 78, with a vertical line at 71
- Draw a whisker from 78 to 84