QUESTION IMAGE
Question
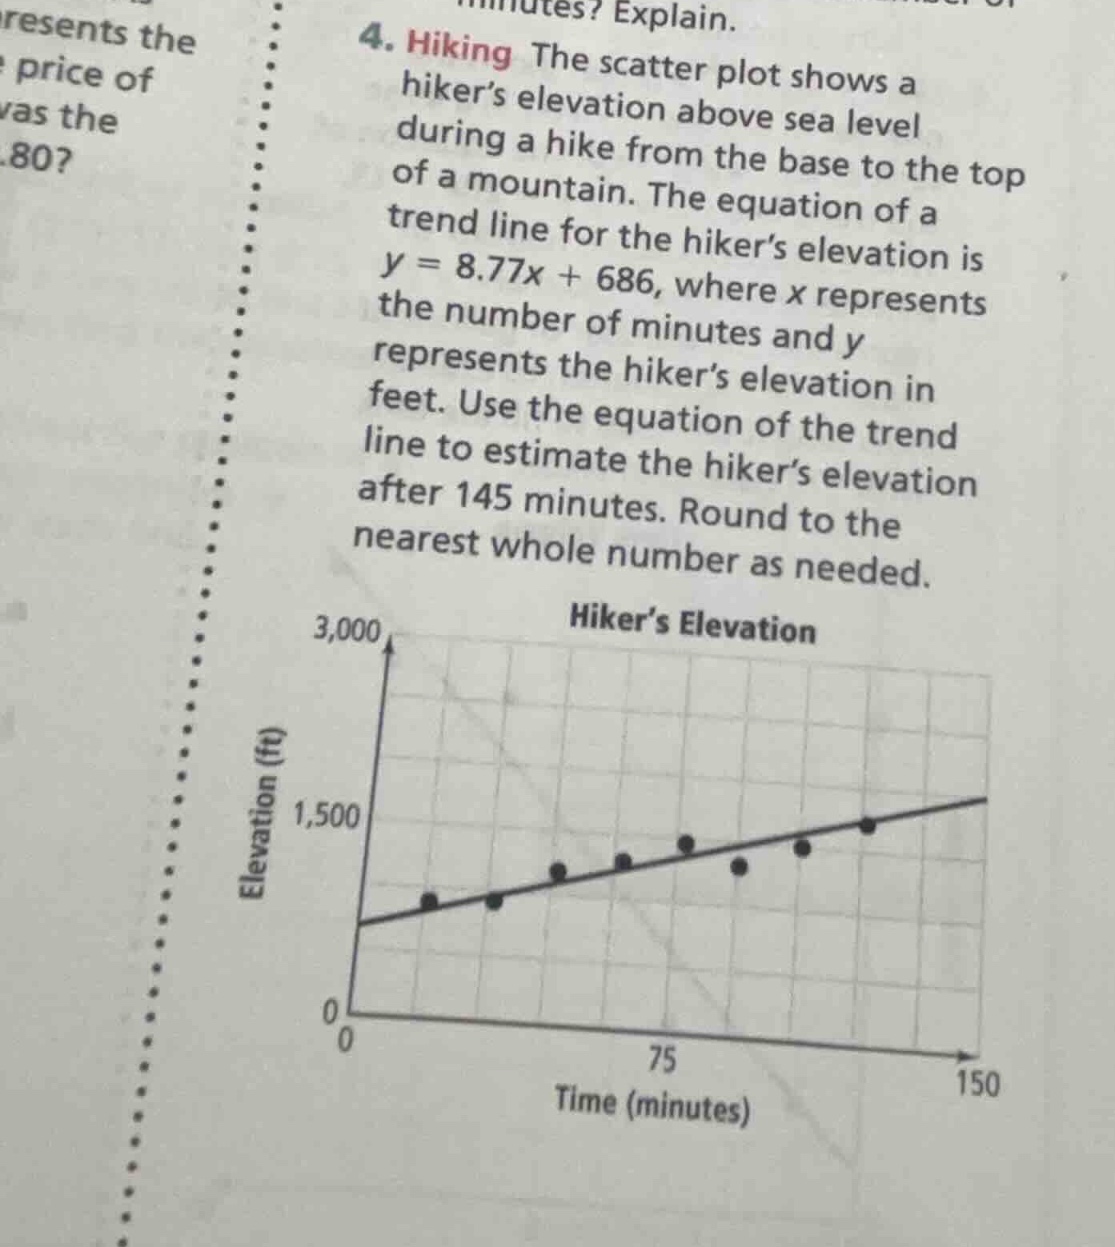
- hiking the scatter plot shows a hiker’s elevation above sea level during a hike from the base to the top of a mountain. the equation of a trend line for the hiker’s elevation is $y = 8.77x + 686$, where $x$ represents the number of minutes and $y$ represents the hiker’s elevation in feet. use the equation of the trend line to estimate the hiker’s elevation after 145 minutes. round to the nearest whole number as needed.
scatter plot titled hiker’s elevation with x - axis time (minutes) from 0 to 150 and y - axis elevation (ft) from 0 to 3000, showing a trend line and data points
Step1: Substitute x=145 into equation
$y = 8.77\times145 + 686$
Step2: Calculate the product term
$8.77\times145 = 1271.65$
Step3: Sum to find y value
$y = 1271.65 + 686 = 1957.65$
Step4: Round to nearest whole number
$y \approx 1958$

Snap & solve any problem in the app
Get step-by-step solutions on Sovi AI
Photo-based solutions with guided steps
Explore more problems and detailed explanations
1958 feet