QUESTION IMAGE
Question
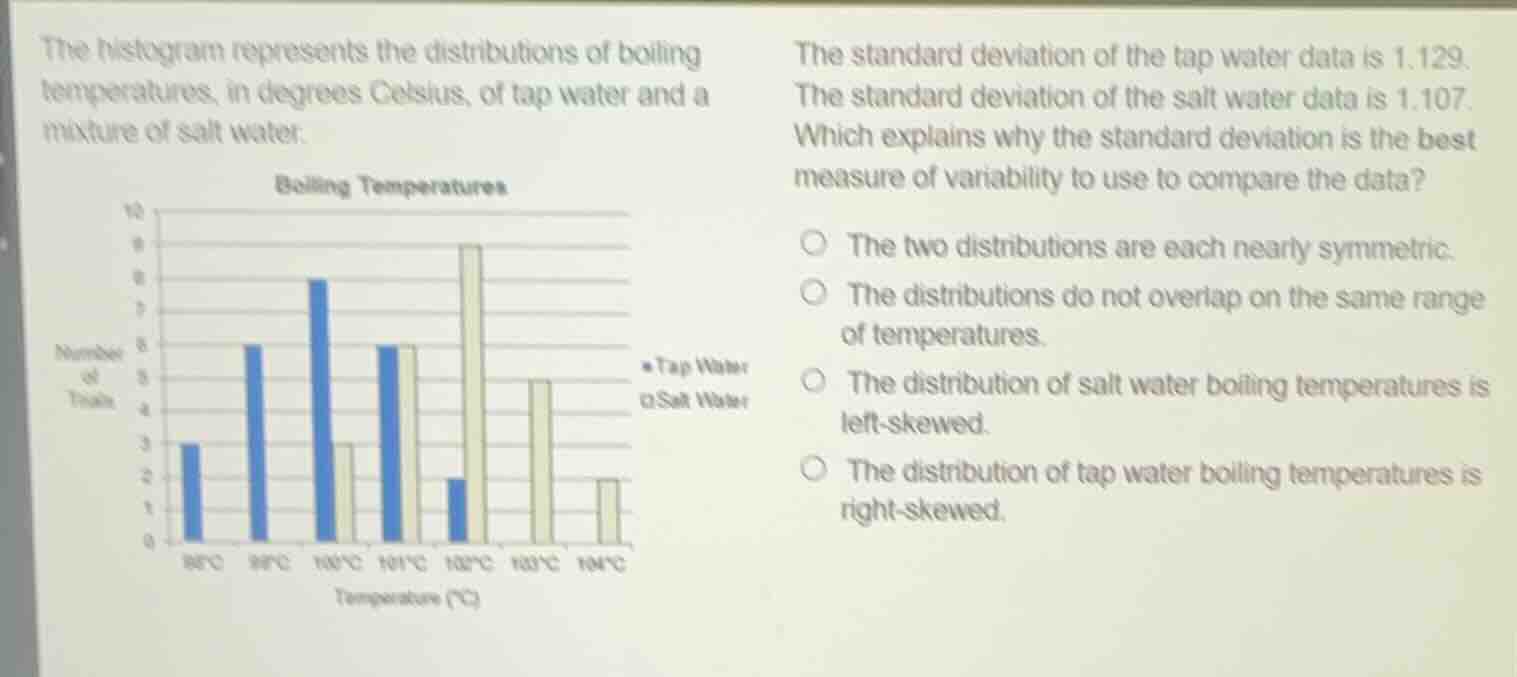
the histogram represents the distributions of boiling temperatures, in degrees celsius, of tap water and a mixture of salt water.
the standard deviation of the tap water data is 1.129. the standard deviation of the salt water data is 1.107. which explains why the standard deviation is the best measure of variability to use to compare the data?
the two distributions are each nearly symmetric.
the distributions do not overlap on the same range of temperatures.
the distribution of salt water boiling temperatures is left - skewed.
the distribution of tap water boiling temperatures is right - skewed.
To determine why standard deviation is the best measure of variability, we analyze each option:
- Option 1: Standard deviation is appropriate for symmetric (or nearly symmetric) distributions. For skewed distributions, interquartile range (IQR) is better. If both distributions are nearly symmetric, standard deviation (which measures spread around the mean) is suitable.
- Option 2: Overlap of ranges does not determine the best variability measure. Variability measures relate to spread, not range overlap.
- Option 3: A left - skewed distribution (salt water) would make IQR a better measure (since mean is affected by skewness), so standard deviation is not ideal here.
- Option 4: A right - skewed distribution (tap water) would also favor IQR over standard deviation (as mean is pulled by skewness).
Thus, the only valid reason is if both distributions are nearly symmetric, making standard deviation (a mean - based variability measure) appropriate.

Snap & solve any problem in the app
Get step-by-step solutions on Sovi AI
Photo-based solutions with guided steps
Explore more problems and detailed explanations
A. The two distributions are each nearly symmetric.