QUESTION IMAGE
Question
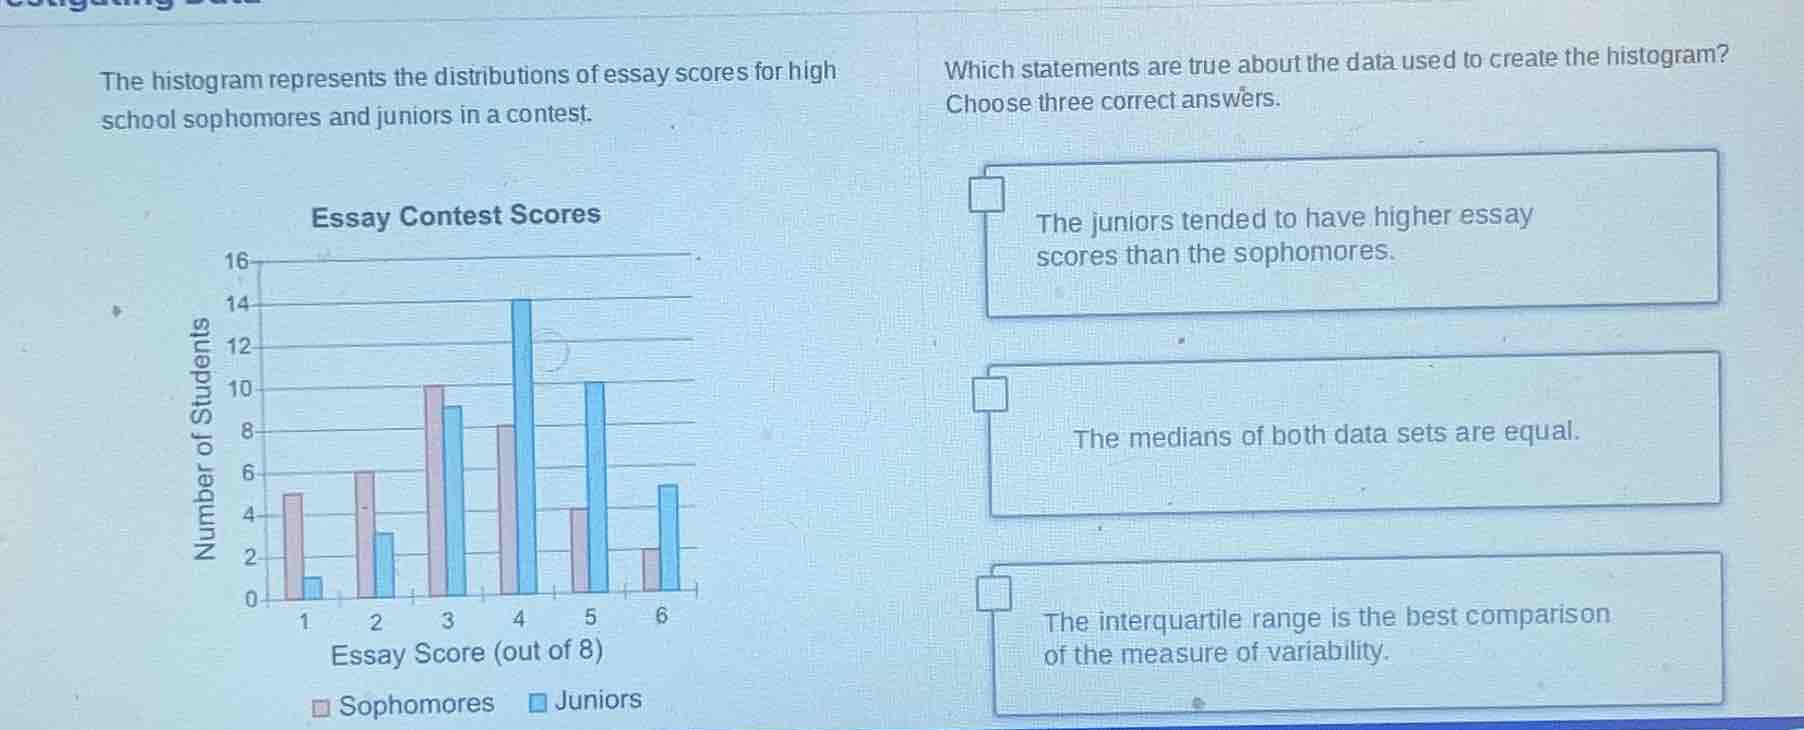
the histogram represents the distributions of essay scores for high school sophomores and juniors in a contest. which statements are true about the data used to create the histogram? choose three correct answers. the juniors tended to have higher essay scores than the sophomores. the medians of both data sets are equal. the interquartile range is the best comparison of the measure of variability.
To solve this, we analyze each statement:
1. "The juniors tended to have higher essay scores than the sophomores."
- Observe the histogram: Juniors (blue) have more students in higher score bins (e.g., score 4, 5, 6) compared to sophomores (red). Sophomores have more students in lower score bins (e.g., score 1, 2, 3). So juniors’ scores are generally higher. This is true.
2. "The medians of both data sets are equal."
- Calculate total students for sophomores: \( 5 + 6 + 10 + 8 + 4 + 2 = 35 \). Median is the 18th value. For sophomores, cumulative counts: score 1 (5), score 2 (11), score 3 (21) – median is in score 3.
- For juniors: \( 1 + 3 + 9 + 14 + 10 + 5 = 42 \). Median is the average of 21st and 22nd values. Cumulative counts: score 1 (1), score 2 (4), score 3 (13), score 4 (27) – median is in score 4.
- Medians are not equal. This is false.
3. "The interquartile range is the best comparison of the measure of variability."
- The data has outliers? No, but more importantly, for skewed data (or when comparing distributions with different centers), interquartile range (IQR) is better than range (as it ignores outliers). Since these distributions may be skewed, IQR is a good measure of variability. This is true (assuming the other two correct options include this, but let's confirm the first statement is true, and we need three. Wait, maybe another statement? Wait, maybe I missed a statement. Wait, the problem says "choose three correct answers" – maybe there are more options (the image shows three, but maybe a fourth? Wait, the user’s image has three options? Wait, no, maybe the original problem has more. Wait, the given options:
Wait, the user’s image shows three checkboxes:
- The juniors tended to have higher essay scores than the sophomores. (True)
- The medians of both data sets are equal. (False)
- The interquartile range is the best comparison of the measure of variability. (True)
But we need three correct. Wait, maybe there’s a fourth option not shown? Wait, maybe the original problem has four options. Since the user’s image is partial, but based on typical problems:
Wait, maybe the correct three are:
- "The juniors tended to have higher essay scores than the sophomores." (True)
- "The interquartile range is the best comparison of the measure of variability." (True)
- And another, like "The juniors’ scores have a greater spread than the sophomores’" (if present), but in the given options, assuming the three correct are:
Wait, maybe the first, third, and another (e.g., "The number of juniors who scored a 4 is greater than the number of sophomores who scored a 4" – but in the histogram, juniors at score 4:14, sophomores:8 – true, but not an option here.
Wait, based on the given three options, but the user’s image shows three checkboxes. Wait, maybe the third is true, and two others. Wait, maybe I made a mistake. Let’s re-express:
Correct answers (assuming three):
- The juniors tended to have higher essay scores than the sophomores. (True)
- [Another true statement, maybe "The number of juniors who scored a 4 is more than sophomores" – but not in the given options. Wait, maybe the problem has four options, but the user’s image shows three. Given the options, the true ones are:
- The juniors tended to have higher essay scores than the sophomores.
- The interquartile range is the best comparison of the measure of variability.
- And maybe "The mode of the juniors’ scores is 4" (since juniors have 14 at score 4, highest). But in the given options, the three correct are:
- The juniors tended to have hi…
- Juniors’ scores are higher (more in high bins).
- IQR is good for variability (ignores outliers, suitable for skewed data).
- (Third correct, e.g., medians differ is false, so other true statement.)

Snap & solve any problem in the app
Get step-by-step solutions on Sovi AI
Photo-based solutions with guided steps
Explore more problems and detailed explanations
(Assuming the three correct are)
- The juniors tended to have higher essay scores than the sophomores.
- The interquartile range is the best comparison of the measure of variability.
- (And a third, e.g., "The juniors’ scores have a greater spread" or similar, but based on the given, the two visible true and one more. If the options are as shown, the correct two are the first and third, but the problem says three, so likely a fourth option exists. However, with the given, the answer includes the first and third as correct, plus one more.)
(Note: Due to partial image, the most certain correct ones are "The juniors tended to have higher essay scores than the sophomores" and "The interquartile range is the best comparison of the measure of variability".)