QUESTION IMAGE
Question
Question was provided via image upload.
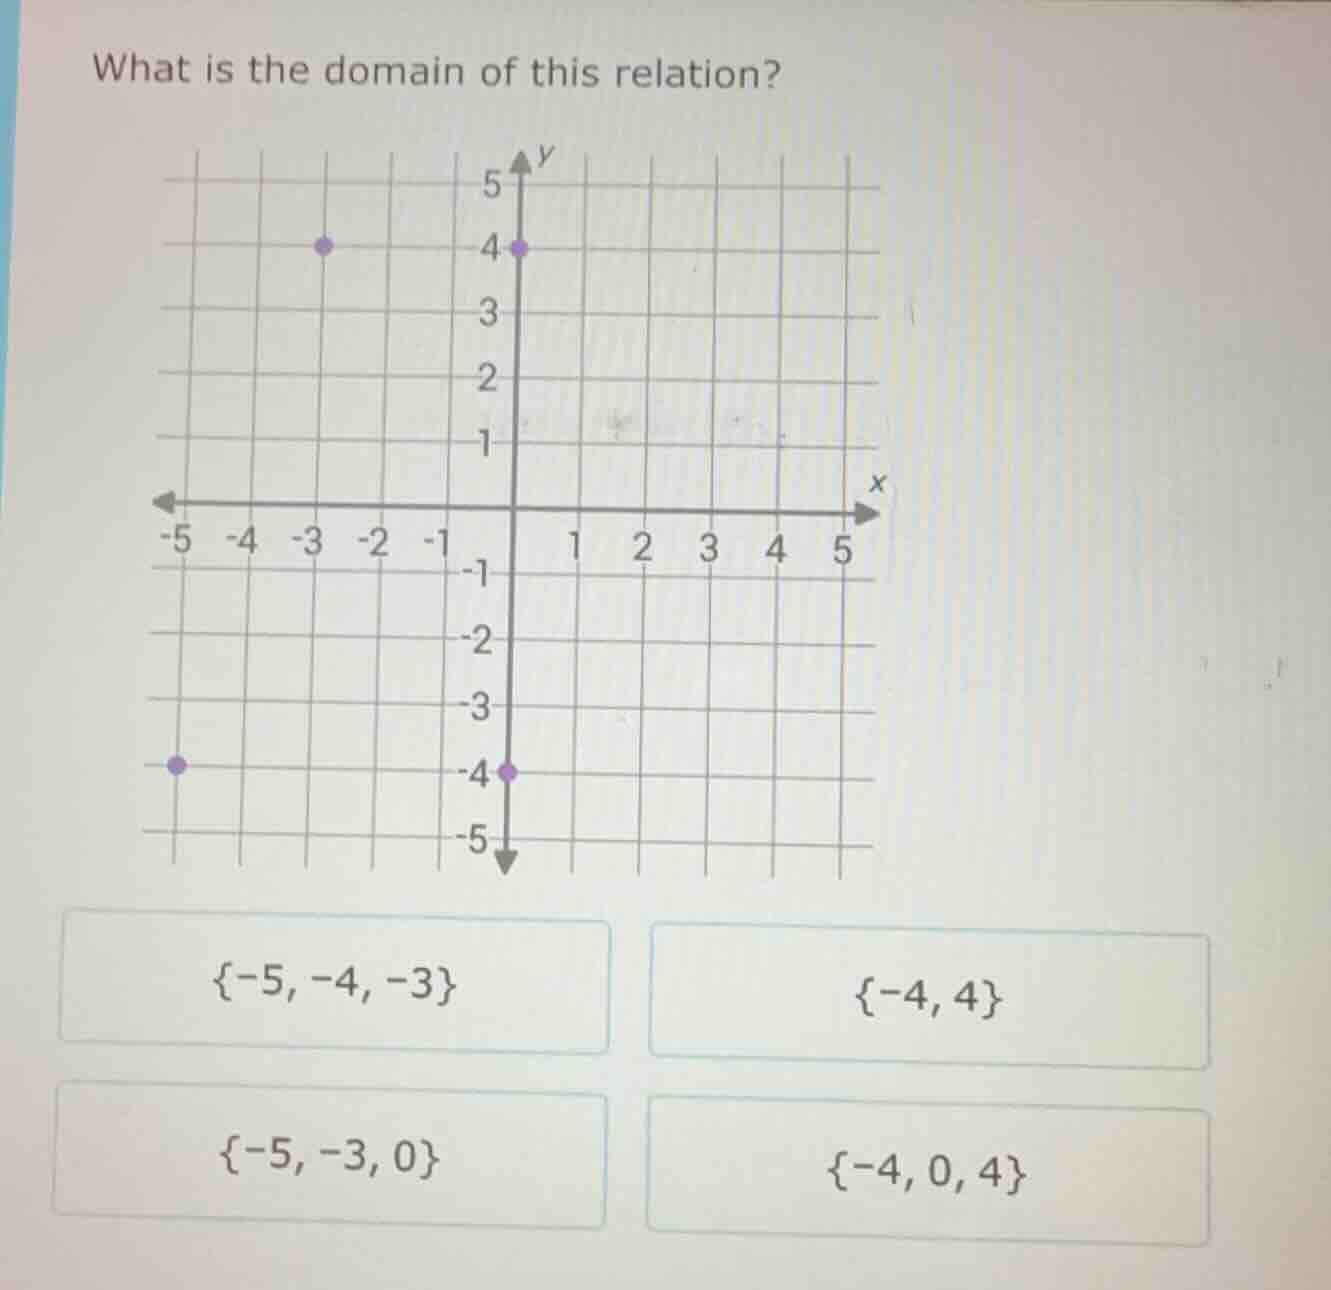
Step1: Identify the points
First, we identify the coordinates of the plotted points. From the graph, the points are \((-5, -4)\), \((-3, 4)\), and \((0, 4)\) (wait, no, looking again: the points are at \((-5, -4)\), \((-3, 4)\), and \((0, 4)\)? Wait, no, let's check the x - coordinates. The x - coordinates of the points: one point is at \(x=-5\) (since the dot is at x=-5, y=-4), another at \(x = - 3\) (x=-3, y=4), and another at \(x = 0\) (x=0, y=4) and \(x = 0\) (x=0, y=-4)? Wait, no, the graph has points: let's list the x - values. The points are: \((-5, -4)\), \((-3, 4)\), \((0, 4)\), \((0, -4)\)? Wait, no, looking at the grid: the purple dots are at (-5, -4), (-3, 4), (0, 4), (0, -4)? Wait, no, the y - axis has a dot at (0,4) and (0, - 4), and x=-3 has a dot at y=4, x=-5 has a dot at y=-4. So the x - coordinates (domain) are the x - values of each point. So the x - values are - 5, - 3, 0. So the domain is \(\{-5, - 3, 0\}\).

Snap & solve any problem in the app
Get step-by-step solutions on Sovi AI
Photo-based solutions with guided steps
Explore more problems and detailed explanations
\(\{-5, -3, 0\}\)