QUESTION IMAGE
Question
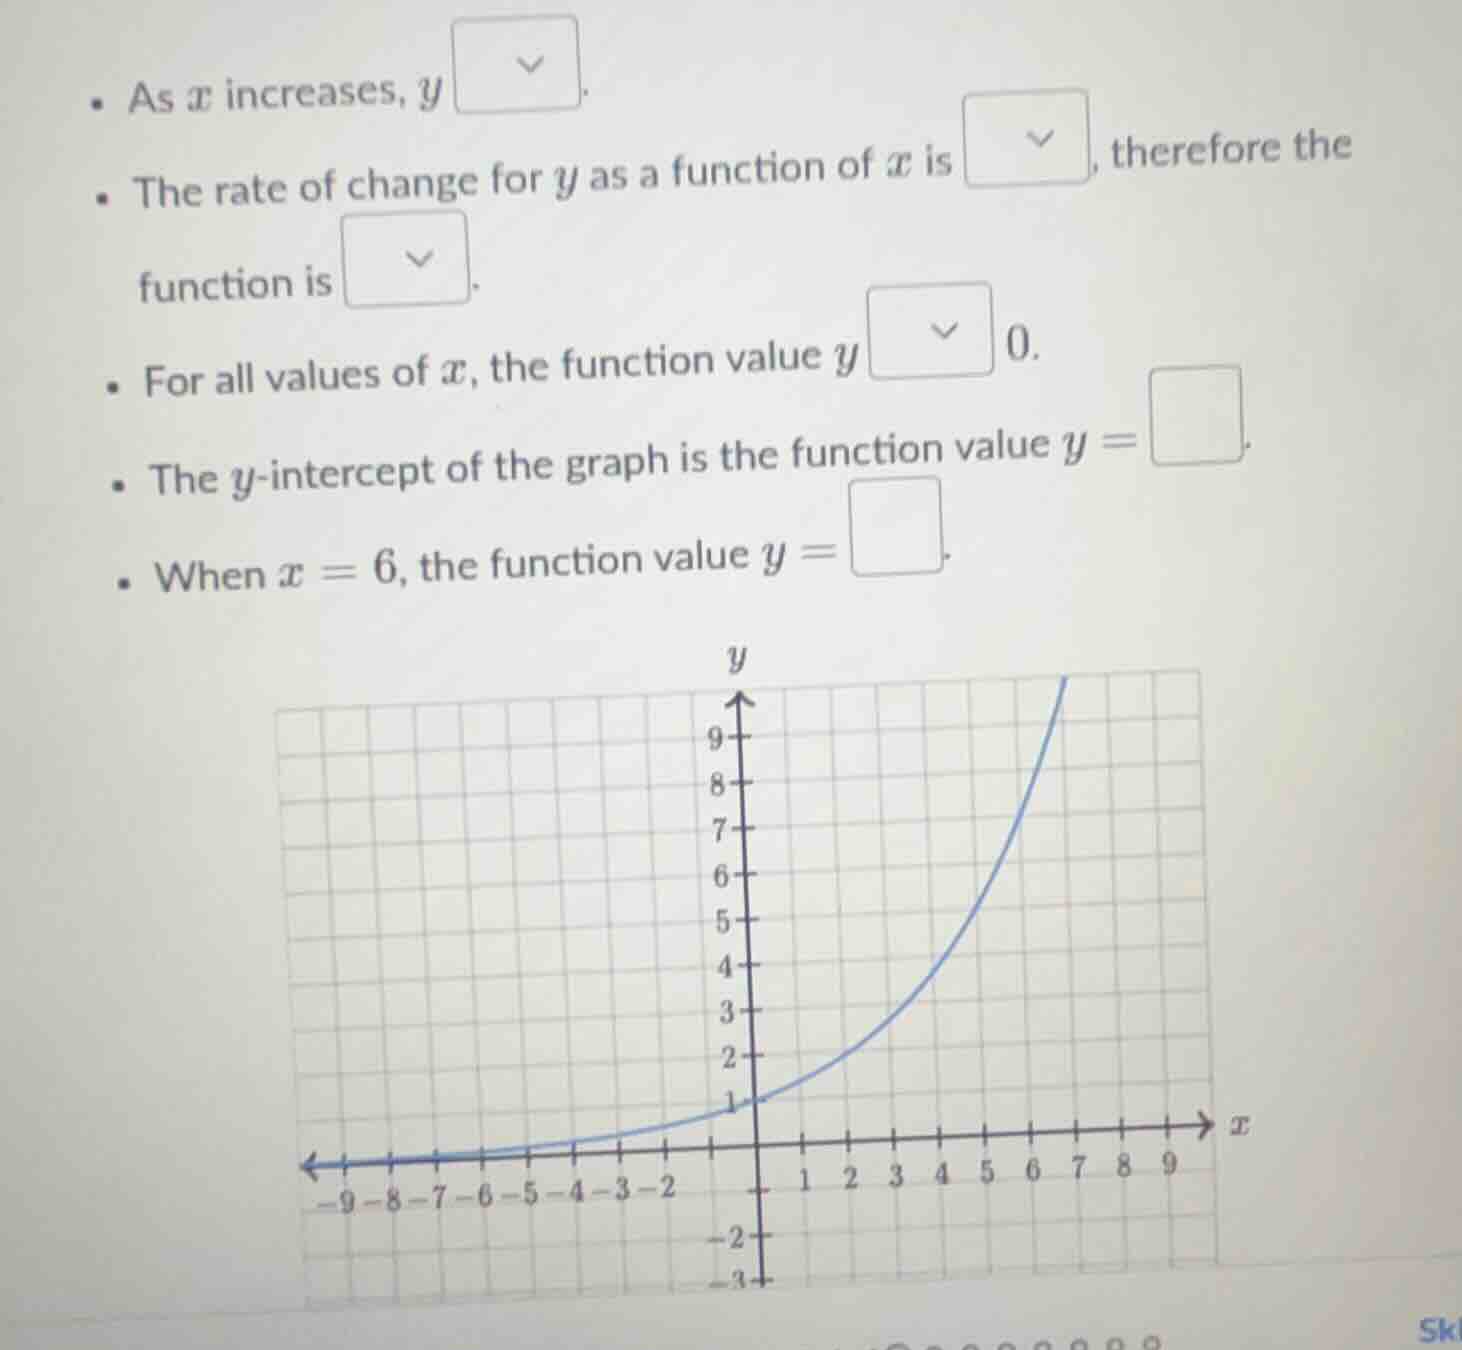
- as ( x ) increases, ( y ) (\boxed{quad}).
- the rate of change for ( y ) as a function of ( x ) is (\boxed{quad}), therefore the function is (\boxed{quad}).
- for all values of ( x ), the function value ( y ) (\boxed{quad}) 0.
- the ( y )-intercept of the graph is the function value ( y = )(\boxed{quad}).
- when ( x = 6 ), the function value ( y = )(\boxed{quad}).
graph of a function on a coordinate plane with x-axis from -9 to 9 and y-axis from -3 to 9, showing a curve starting near the x-axis on the left, rising through (0,1) and increasing more steeply as x increases
Step1: Analyze x-y trend
Observe the graph: as $x$ moves right (increases), $y$ moves up.
Step2: Identify rate of change type
The graph is a curve, so the slope (rate of change) increases as $x$ increases, meaning it is non-constant. This makes the function exponential (non-linear).
Step3: Check y vs 0
All points on the graph lie above the $x$-axis ($y=0$), so $y > 0$ for all $x$.
Step4: Find y-intercept
The y-intercept is where $x=0$. From the graph, at $x=0$, $y=1$.
Step5: Find y at x=6
Locate $x=6$ on the x-axis, move up to the graph: the corresponding $y$-value is 7.

Snap & solve any problem in the app
Get step-by-step solutions on Sovi AI
Photo-based solutions with guided steps
Explore more problems and detailed explanations
- As $x$ increases, $y$ increases.
- The rate of change for $y$ as a function of $x$ is non-constant, therefore the function is non-linear (exponential).
- For all values of $x$, the function value $y$ is greater than 0.
- The $y$-intercept of the graph is the function value $y = 1$.
- When $x = 6$, the function value $y = 7$.